
A theory of change is a plain-language, visual explanation of the change your project is trying to produce, the preconditions that have to happen first, and the assumptions you believe must hold for that change to show up. Here is how to write a theory of change for a civic tech project: work backwards from the public outcome, name what your product actually delivers, and test the whole chain with the people who use the service.
A full draft takes a focused afternoon for a solo builder, or one 90-minute workshop if you can get the right people in a room. You do not need evaluation training, a paid tool, or a designer. You need one honest sentence about the civic problem, and the honesty to write down which parts of your theory you are guessing at.
Here is the whole method in seven moves:
- Define the civic problem and the change you want to see.
- List your inputs, then the activities and outputs they produce.
- Map short-, medium- and long-term outcomes back from your goal.
- Write the causal logic linking each step, not just arrows.
- Name the assumptions and external factors you do not control.
- Attach indicators, baselines, targets and dates to each outcome.
- Test the pathway with stakeholders, simplify it, and schedule revisions.
The rest of this guide walks through each move, then shows a copy-paste skeleton and a worked example for a 311-style service request platform, because the hard part of a civic tech theory of change is rarely the diagram. It is deciding which link in the chain your software is honestly allowed to claim.
Table of Contents
- What You Need
- Step-by-Step
- 1. Define the Civic Tech Problem and the Change You Want
- 2. Identify Your Inputs, Activities, and Outputs
- 3. Map Short-, Medium-, and Long-Term Outcomes
- 4. State the Causal Logic Between Each Step
- 5. Make Assumptions and External Factors Explicit
- 6. Add Indicators, Baselines, Targets, and Timeframes
- 7. Review, Test, and Simplify the Complete Model
- How to write a theory of change for a civic tech project with no workshop budget
- Common Mistakes
- Frequently Asked Questions
- What is a theory of change and what is it not?
- What are the five components of a theory of change?
- How long should it take to write one?
- Who needs to be involved in writing one for a civic tech project?
- What is the difference between a theory of change and a logic model?
- Conclusion
What You Need
Five things, and none of them require a budget.
A one-page project brief. What is being built, for whom, and by when. If you cannot write this, the theory of change will expose that, which is useful.
Stakeholder perspectives, not just stakeholder names. One line from a frontline caseworker, one from a resident who has used (or refused) the service, one from the data team. Ten people at a workshop is too few for a good theory of change; three people whose jobs actually change is usually enough to find the weak link.
Whatever evidence you already have. Existing complaint volumes, request data, call centre logs, prior project evaluations, published research on the problem. With no data at all, you write the theory as a hypothesis and measure it in the pilot, which is a legitimate move, not a failure.
A realistic list of resources. Developers you actually have (staff, volunteers, a contractor), the procurement status of any city partner, and the data you can lawfully access.
A clear definition of who the beneficiaries are. Not “the community”. A 311 platform has at least three distinct groups: residents reporting issues, frontline staff triaging them, and the department that owns the fix. They will not experience your theory the same way.
Before you start, write one sentence describing the civic problem in your own words, with no technology in it. If the sentence has to mention the app, the problem statement is not finished yet.
Step-by-Step
1. Define the Civic Tech Problem and the Change You Want
Start with the problem, then the change. For a pothole reporting app, the problem is not that reporting is hard, it is that reported street defects stay unrepaired for months because the queue has no owner and no deadline. The change you want is a shorter, more accountable repair path.
Now separate the product outcome from the public outcome. The product outcome is that a resident can submit a geotagged photo report in under a minute. The public outcome is that street defects get fixed faster and residents stop abandoning the reporting channel because it never worked. One is your team’s deliverable. The other is the thing a councillor or a resident will actually notice, and only the second one belongs at the top of your diagram.
How do you know which is which? Ask whether the outcome would still be true if your software were replaced by a working phone number. If yes, it is a public outcome, and your product is one of several possible routes to it. That single test keeps your theory of change honest and stops you claiming credit for things the city does through other means.
2. Identify Your Inputs, Activities, and Outputs

Inputs are what you consume: engineering time, a data engineer, a designer, legal review, an open data licence, a signed data sharing agreement with the city, funding for two years. Be specific about people and months rather than vague commitments. “Two developers for 14 months” is a real input. “A strong team” is not.
Activities are what the team does with those inputs: discovery interviews with residents, data pipeline work, building the reporting form, training call centre staff, running a pilot in two wards, writing a public API, holding monthly reviews of unresolved requests.
Outputs are what exist afterwards: a working reporting form, a public status tracker, an open dataset of resolved requests, 40 call centre staff trained, an API used by two community groups. This is the box most civic tech teams overstate, because outputs feel like progress and they are the easiest thing to count.
Keep the list short. Six inputs, eight activities, six outputs is plenty for a two-year project. If your output list runs to twenty items, you have written a work plan and labelled it a theory of change.
3. Map Short-, Medium-, and Long-Term Outcomes
Work backwards from the top. For the 311 example, the long-term goal is a city where street defects are fixed and residents can see it happen. The medium-term outcome is departmental accountability: named owners, published resolution times, and a queue that is visible to supervisors rather than buried in an inbox.
The short-term outcomes are closer to behaviour. Residents report through the channel instead of calling or giving up. Triage staff route reports to the right crew within a day. Supervisors actually open the dashboard. Each of those is a change in what someone does, not a change in what exists.
Chain two to four outcomes per level, not ten. A long chain of arrows is a sign you have merged several theories together, and each extra link is a place the whole argument can break. If you cannot say in one sentence why outcome A leads to outcome B, either you have skipped a step or your theory is wrong. Both are worth knowing before you build.
4. State the Causal Logic Between Each Step
This is the step that separates a theory of change from a flowchart, and it is the one most digital projects skip. An arrow is an assertion. A rationale is an argument.
Instead of “trained staff -> faster resolution”, write: frontline staff resolve a share of reports during the call or first follow-up, so the request never enters the slow queue, so median resolution time falls. Each link names a mechanism. A mechanism is a reason, and reasons can be argued about, which is what makes the theory testable.
Ask three questions at every arrow. What has to be true for this to work? What behaviour changes? Who or what responds? If an arrow has no behaviour in it, you are describing hope rather than a pathway.
One test I like: read the chain out loud to someone who has no stake in the project and ask where they would stop believing you. On a 311 theory, most people stop at “residents have smartphones and data”, which is exactly the link that deserved a real argument about assisted digital reporting for people who do not.
5. Make Assumptions and External Factors Explicit
Your assumptions are the conditions the theory depends on but does not control. Put them in a row beneath the diagram, and write what happens if each one fails.
For a civic tech project, these are the ones I write every time:
- Adoption. A share of the affected population will use the digital channel rather than the old one. If it fails, report volume falls and the tool looks like a failure even when the underlying service improves.
- Institutional buy-in. The department that owns the outcome will act on the data. If it does not, your platform becomes a complaints museum.
- Procurement and legal. Data sharing, privacy review, and procurement will clear on the timeline you assumed.
- Data quality. The records you are integrating are complete enough to route work. Empty addresses, duplicate addresses and stale asset registers break routing silently.
- Connectivity and digital exclusion. People without reliable data, devices, or digital confidence can still get the service another way.
- Funding continuity. Maintenance is funded past the pilot. Pilots end; the maintenance never appears in anyone’s budget.
- Vendor lock-in. The data and logic stay portable if the supplier changes.
An assumption is only useful if it is falsifiable. “The city cares about this problem” is a belief. “The council will name a service owner for street defects before the pilot starts” is a checkable statement, and you can put a date on finding out.
6. Add Indicators, Baselines, Targets, and Timeframes
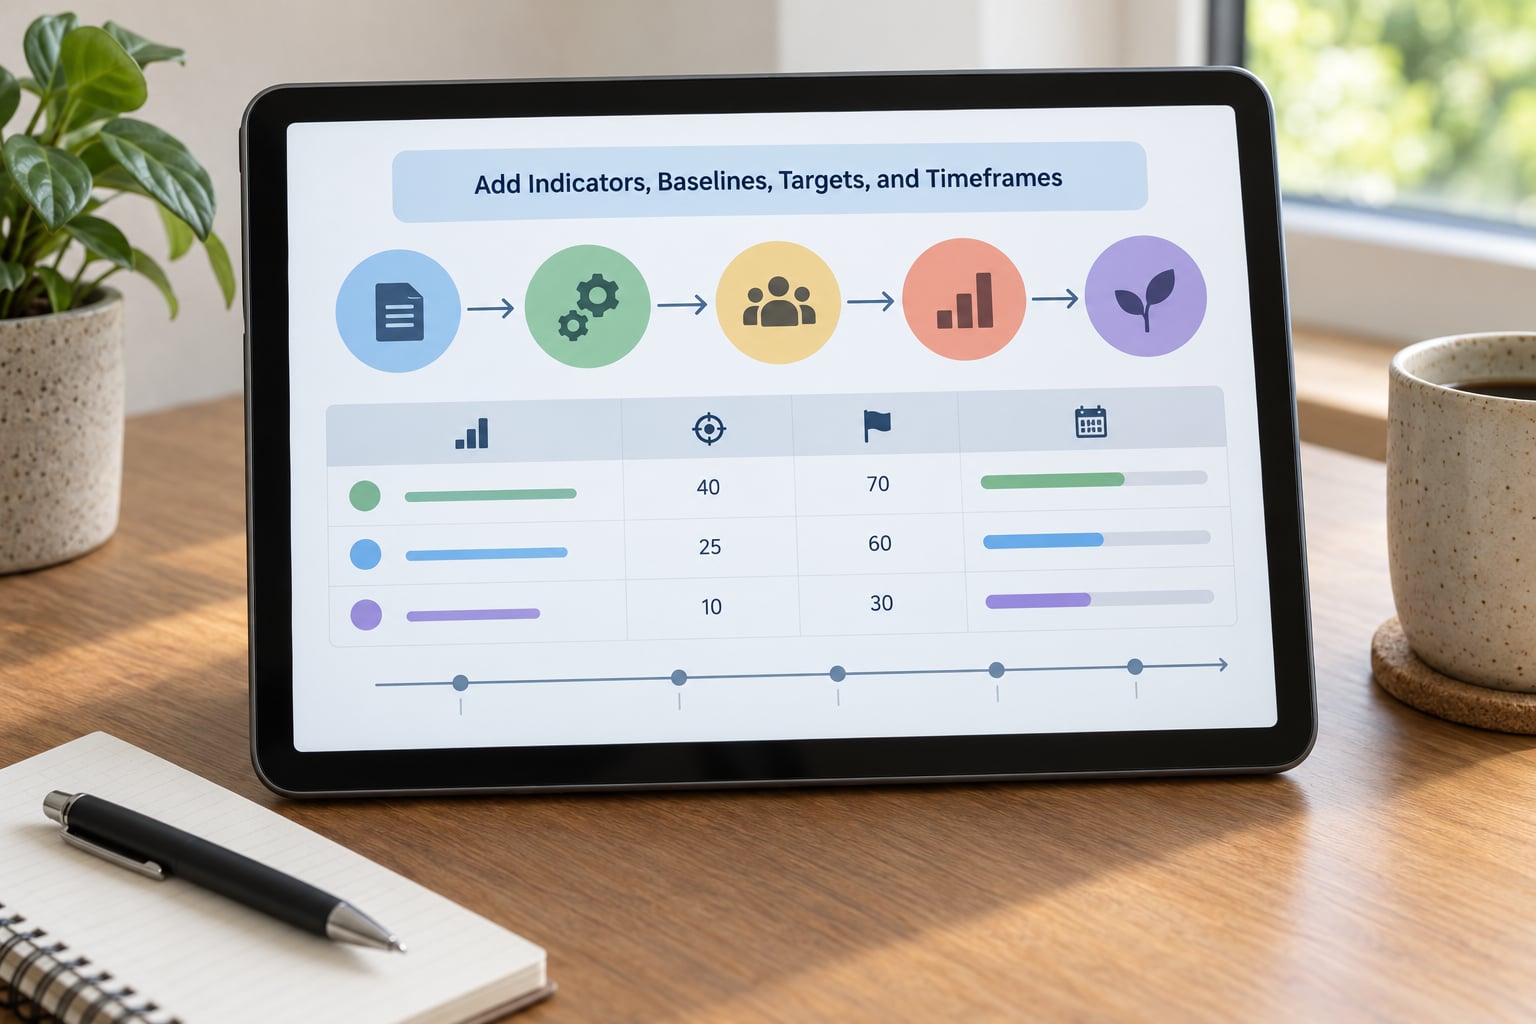
An outcome without an indicator is a hope. Attach one or two indicators to each outcome, say where the number comes from, and date the measurement.
Where you have no baseline, say so and take one in the first month of the pilot. A baseline you measure at the start beats an estimate you defend later, and funders forgive a missing baseline far more readily than a wrong one.
Tech indicators are easy to collect and easy to over-read. Registered accounts and monthly active users tell you about your funnel, not about the city. Resolution time, percentage of reports closed within the published standard, and the share of residents who report again after a successful fix tell you about outcomes. Pull requests, API call volume and page views are delivery signals, and they belong in the outputs column where they cannot flatter the results.
Set targets that a route to the outcome would actually produce. Cutting median resolution time by half in nine months usually means you will close easy tickets and leave the hard ones, which is why you pair the time target with a volume target. Report both together or a reviewer will find the trade-off before you do.
7. Review, Test, and Simplify the Complete Model
Walk the diagram with people who were not in the room that drafted it. Give frontline staff the output-to-outcome links and ask whether the routing change you predict is realistic given their queue. Give residents the goal and ask whether they would consider the problem solved. Disagreement here is data, and it is cheaper than a failed pilot.
Then strip it back. Every theory of change I have seen reviewed went through the same edits: jargon out (“empowerment pathways” becomes “people use the service”), vague quantities replaced with numbers, and a fourth outcome deleted because nothing would ever measure it. A one-page theory beats a twelve-page one, because a one-page one still gets read in year two.
Give the document a home and a review date. Quarterly during the pilot, then twice a year, and always after a change of supplier, a change of policy, or a published evaluation. If the diagram lives only in a slide deck, it will quietly stop being true within a year of launch.
The copy-paste skeleton. Drop this into a doc, a Miro board, or a draw.io canvas and fill it in. Everything after “ASSUMPTIONS” is the row people forget.
LONG-TERM GOAL (public outcome)
        ^
        |
OUTCOMES (medium term: what changes in institutions)
        ^
        |
SHORT-TERM OUTCOMES (what people and staff start doing differently)
        ^
        |
OUTPUTS (what exists when the project ends)
        ^
        |
ACTIVITIES (what the team does)  <- INPUTS (people, money, data, time)
        ^
        |
    CIVIC PROBLEM
=============================================================
ASSUMPTIONS (each with: what happens if it fails)
1. ...
2. ...
3. ...
=============================================================
EVIDENCE / INDICATORS: outcome | indicator | source | baseline | target | date
Worked example, filled in. A 311-style service request platform for street defects in one mid-sized city, piloted in two wards for 18 months.
GOAL:  Street defects are fixed and residents can see it happen
OUTCOMES: Departments own named categories with published resolution times
SHORT-TERM: Residents report rather than give up; triage routes within 1 day
OUTPUTS:  Reporting form, public status tracker, open dataset, 40 staff trained
ACTIVITIES: Discovery interviews, pipeline build, form build, staff training,
            2-ward pilot, monthly unresolved-request review, public API
INPUTS:   2 developers (14 months), 0.5 data engineer, 0.5 designer, legal
            review, open data licence, signed data-sharing agreement
PROBLEM:  Reported defects sit unrepaired for months with no owner or deadline
ASSUMPTIONS: adoption; named service owner before pilot; data-sharing agreement
            signed; asset register accurate enough to route; non-digital access
            route stays open; maintenance funded after month 18; data portable
INDICATORS:
  Short-term  - share of reports acknowledged within 1 day | dispatch system |
                baseline 34% | target 80% | month 12
  Short-term  - resident repeat-report rate | survey | baseline 12% | 8% | m18
  Medium-term - median days to resolution | dispatch + tracker | 61 | 35 | m18
  Medium-term - share of defects closed within standard | tracker | 22% | 55% | m18
  Adoption    - report channel mix (app vs phone) | dispatch | baseline app 0% |
                target 30% of reports | month 18
Notice what is not in that diagram. No claim that the platform made the city safer, no user-count target presented as impact, and no assumption that residents will simply adopt the app.
How to write a theory of change for a civic tech project with no workshop budget
Small teams do this with three conversations instead of a facilitated session. Talk to a frontline user, a resident, and whoever signs off on data or procurement; write the diagram alone; then send the draft to those three people with two questions attached: which arrow is wrong, and which assumption is untrue.
That is genuinely enough. A theory of change written by one person is distrusted, but a single-author draft that has been read and corrected by three affected people is a working document, and it is honest about its gaps. Many nonprofit and volunteer-built projects never get a formal workshop, and the ones that survive are the ones whose theory was argued over early.
If a funder asks for a logframe or a logic model instead, that is fine. You are producing the same content in a different container. The long-term goal, preconditions, inputs, outputs, activities and assumptions all appear in a logframe; what you lose is the rationale line, so attach your causal logic sentences as a separate one-page narrative rather than compressing them into a column.
Common Mistakes
Listing activities as outcomes. “Three workshops delivered” is an output at best, and often an input. The outcome is what a workshop causes: caseworkers resolve a larger share of queries themselves. If you cannot name the behaviour that changes, the row is not an outcome row.
Claiming direct impact on the public goal. Your platform is one entry point among several for a defect, a bus route, a pothole. Write your contribution, and if you can, name the other routes that would deliver the same outcome. A theory that survives its own assumptions is more persuasive than one that survives none.
Leaving the assumptions row empty. An empty assumptions box reads as confidence. It should read as the list of things that will kill the project if true, and that is genuinely the most useful page in the document when things start slipping.
Setting targets copied from another city. Benchmarks from a different city, a different service, or a different era are decoration. Take your baseline from your own data, state the comparison you are making, and let the first target be conservative enough to survive contact with a real pilot.
Treating beneficiaries as one group. Residents, frontline staff, and the owning department do not experience the intervention the same way, and often disagree about what success looks like. Split the groups, and expect the theory to change once you have.
Drawing the diagram and moving on. The most common failure is the quietest one: the diagram is written once, presented once, and never revisited, so by year two it describes a project that no longer exists. Put a review date on the document before you circulate it.
Frequently Asked Questions
What is a theory of change and what is it not?
A theory of change is a plain-language explanation of the change you want, the preconditions that must happen first, the activities that cause them, and the assumptions you depend on. It is not a project plan, a budget, or a results table. It is a hypothesis you can test, which is why it needs dates and indicators attached rather than just boxes and arrows.
What are the five components of a theory of change?
The core components are the long-term goal, the preconditions or outcomes that lead to it, the interventions and activities you run, the inputs and outputs those activities produce, and the assumptions the pathway depends on. Add a sixth element for any serious project: indicators, with baselines, targets and dates. Some guidance also lists the underlying problem, which gives the first four components their reason to exist.
How long should it take to write one?
A focused draft takes a few hours if you already know your project, plus the conversations that test it. A 90-minute workshop with the right people in the room is the usual professional route. What takes the time is not the diagram, it is getting agreement on the preconditions, and small teams with volunteers or a part-time contractor should budget days rather than weeks for that part.
Who needs to be involved in writing one for a civic tech project?
Frontline staff and residents matter more than delivery partners, because they are the only people who can tell you whether the predicted behaviour change is realistic. Add the data owner, whoever signs procurement or data-sharing agreements, and someone who can say what happens if funding stops. A group of implementers alone will produce a theory that agrees with itself and predicts nothing useful.
What is the difference between a theory of change and a logic model?
A logic model is a table or diagram that shows the relationship between inputs, outputs, outcomes and impact. A theory of change is the argument underneath it: why each step should cause the next, and which assumptions have to hold. Many funders ask for a logframe and expect the ToC narrative alongside it. The practical difference is that a logic model can be filled in without anyone arguing, while a theory of change cannot.
Conclusion
Start with the copy-paste skeleton and the problem sentence, then do the part everyone skips: pick the weakest arrow and argue about it with a frontline user and a resident. If that conversation holds, you have a theory of change worth funding. If it does not, better to find that out on paper this month than in a pilot report at the end of 2026.