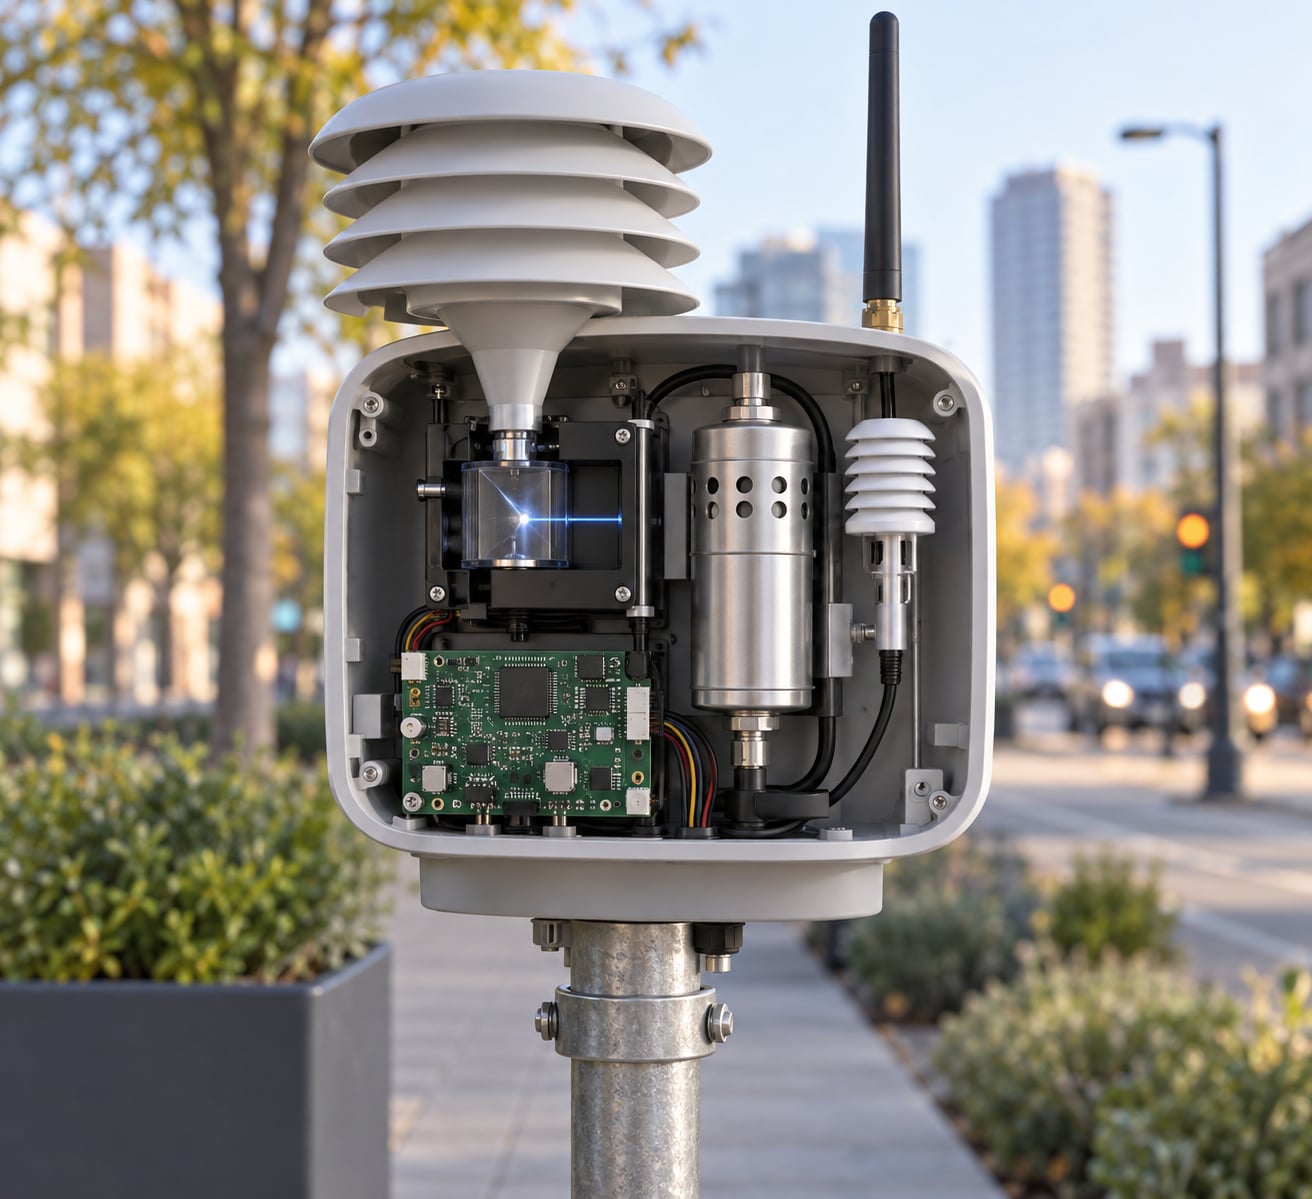
Air quality sensors measure pollution by drawing a known volume of ambient air into an inlet, detecting a pollutant-specific property of what is in that air, and converting that detection into an electrical signal that is then calibrated into a concentration. For particulates that signal is scattered laser light, for gases it is absorbed infrared radiation, a reaction current, or a change in conductivity. Everything a public AQI figure shows is built on top of that chain.
The chain has weak links, and knowing where they are matters more than knowing the sensor’s headline accuracy. A number that ignores humidity, warm-up time and placement can be worse than useless, because a plausible-looking reading gets treated as fact. This guide walks through each stage, from air intake to published index value, and marks where a cheap node and a regulatory-grade station part company.
Updated for October 2026. References the WHO 2021 global air quality guidelines and current US EPA index breakpoints.
Table of Contents
- What Do Air Quality Sensors Actually Measure?
- How Air Quality Sensors Measure Pollution Step by Step
- How Do Particle Sensors Detect PM2.5 and PM10?
- How Do Sensors Measure Gases Such as Ozone and Nitrogen Dioxide?
- What Environmental Factors Can Change a Sensor Reading?
- How Is Raw Sensor Data Turned Into an Air Quality Index?
- How Accurate Are Low-Cost Air Quality Sensors?
- How Should Cities Choose and Place Air Quality Sensors?
- What Are the Limits of Air Quality Sensor Data?
- Frequently Asked Questions
- Do air quality sensors measure pollution directly?
- How long does an air quality sensor take to produce a reliable reading?
- Can a household sensor replace an official air quality monitoring station?
- Why does humidity affect low-cost air quality sensor readings?
- Are air quality sensors safe to use inside homes and schools?
- Start With the Reading You Want to Make
What Do Air Quality Sensors Actually Measure?
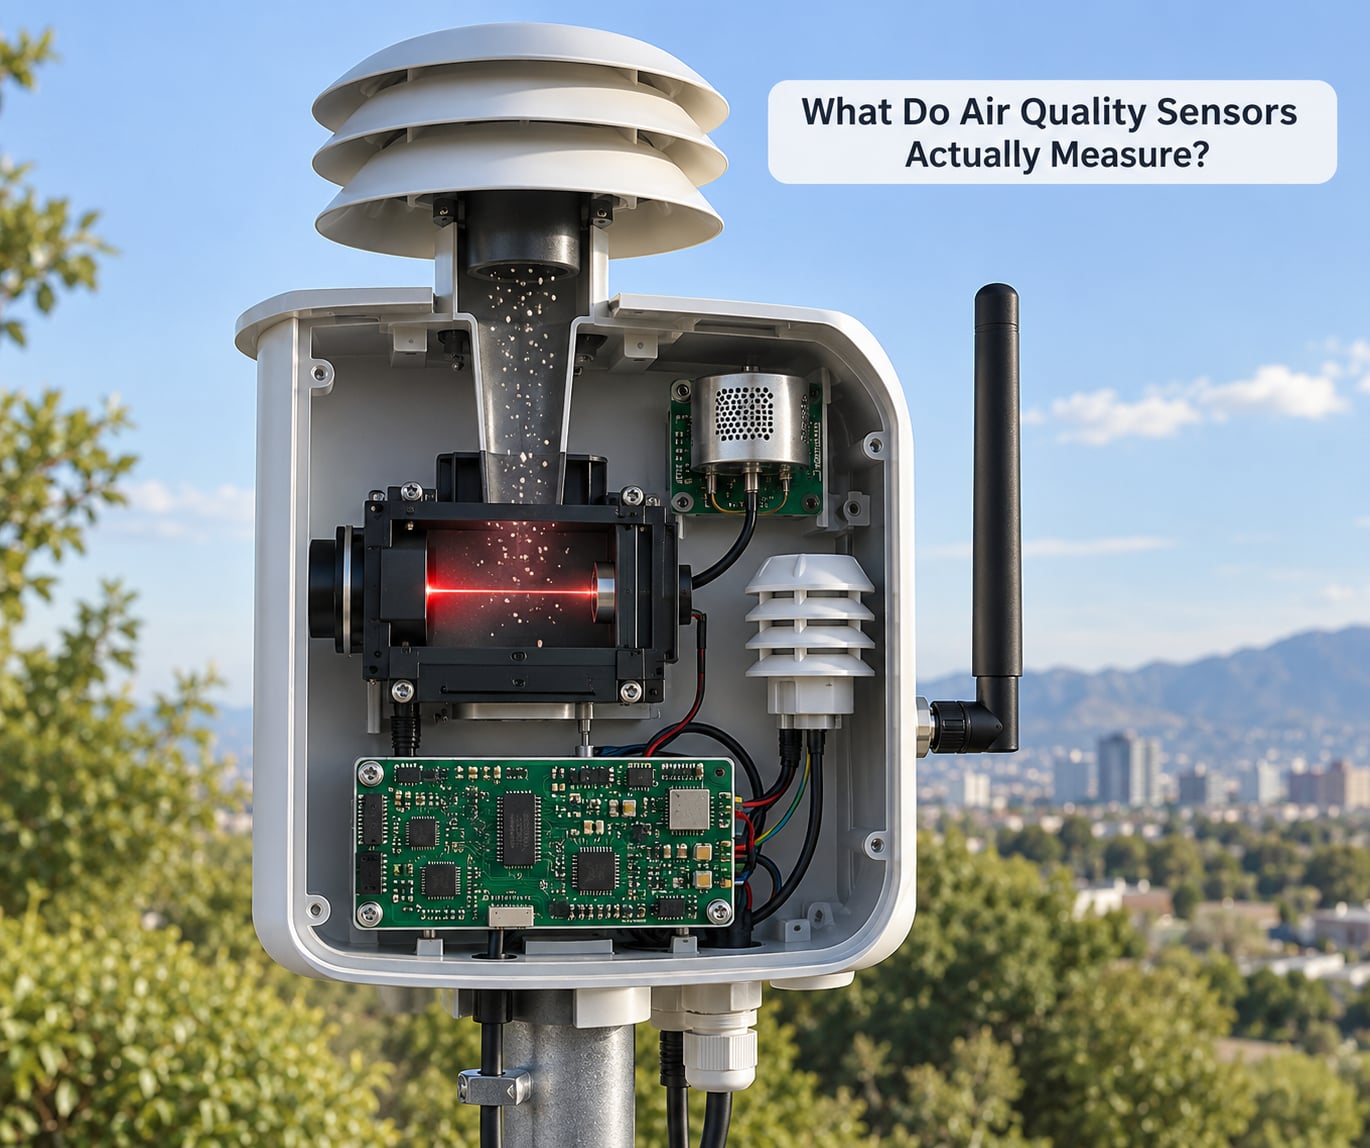
An air quality sensor does not measure “pollution” as a single quantity. It measures one or a few specific pollutants, each through a physical or chemical property that sensor type is built to detect.
Particulates are described by aerodynamic diameter. PM2.5 is the mass of particles small enough to pass through the neck of a human lung, PM10 is everything below ten micrometres, and PM1 is the sub-micron fraction that dominates in some city centres. Mass concentration is reported in micrograms per cubic metre (µg/m³). Gases are reported in parts per billion (ppb) or parts per million (ppm), a volume ratio rather than a mass one. Carbon dioxide sits in the same unit family but is a ventilation proxy rather than a pollutant.
A sensor node and a regulatory monitoring station are not the same instrument class. A reference station uses analysers such as chemiluminescence devices for nitrogen oxides, UV photometry for ozone and beta attenuation for fine particle mass, with inlet lines, sample conditioning and calibration procedures built in. A low-cost node does one or two of those jobs with far simpler physics, then gets corrected in software. The node is a data point. The station is the anchor the data points are measured against.
How Air Quality Sensors Measure Pollution Step by Step
- Air intake. A pump or a passive diffusion inlet pulls ambient air through a baffled inlet tube. The design goal is a known flow rate and a clean line of sight to the air, with insects and rain kept out without trapping the air inside the housing.
- Particle detection. In an optical particle counter, a laser beam passes through the air stream and a photodiode collects light scattered at ninety degrees by each particle. Each scattering event is one count, and the signal pulse height maps to a particle size band.
- Gas sensing. Electrochemical cells produce a current from a target-specific reaction, NDIR cells measure the dip in infrared transmission at an absorption band, and heated metal oxide sensors change resistance in the presence of reducing gases.
- Signal conversion. The electronics convert counts per minute, microamps or absorbance into a raw number, then apply the sensor’s calibration curve to produce a concentration.
- Correction. Temperature and relative humidity are measured on the same board and fed into an algorithm, because the raw optical and electrochemical responses both shift with the weather.
- Averaging. Values are averaged over the reporting period, usually ten seconds to a minute for the raw feed and hours or a day for the regulatory value.
- Transmission. The node sends data over cellular, LoRaWAN or Wi-Fi to a gateway that forwards it to a dashboard or open API.
How Do Particle Sensors Detect PM2.5 and PM10?
An optical particle counter never weighs anything. It counts particles in discrete size channels and then estimates mass.
When a laser crosses a particle, the light scattered off it scales with particle size, refractive index and shape. The photodiode converts each event into a pulse, and the firmware bins those pulses into channels, commonly around 0.3, 0.5, 1.0, 2.5, 5.0 and 10 micrometres. Sum the counts in the channels that fall inside a size range and you have a number concentration, particles per cubic centimetre of air.
Turning number into mass needs an assumed density, and this is where most of the error creeps in. A standard conversion uses roughly 2.65 grams per cubic centimetre, which suits crustal dust but overstates the mass of soot and understates some organic aerosol. Light-scattering aerosol counters also count a big soot particle differently from a big salt particle, so a pure optical reading is really a scattering proxy for mass, not mass.
Humidity is the biggest systematic error in the whole chain. Hygroscopic salts such as ammonium nitrate and sodium chloride absorb water as relative humidity rises, the particle physically grows into a larger optical size, and the sensor reports more mass than is actually there. On a humid night a node can read thirty percent high. Many devices apply an empirical humidity correction curve learned during collocation, and it helps, but it cannot fix a node that has never been collocated.
Gravimetric filter sampling is the other half of the story: a known volume of air is drawn onto a weighed filter, and the mass difference divided by volume gives true mass concentration. It is slow, it needs a filter change and a balance, and it is what optical and beta-attenuation methods are ultimately traced back to.
How Do Sensors Measure Gases Such as Ozone and Nitrogen Dioxide?
| Sensor type | How it detects | Best for | Main limitation |
|---|---|---|---|
| Electrochemical | Reaction current proportional to concentration | NO2, CO, SO2, O3 | Cross-sensitivity, drift, needs warm-up |
| NDIR | Infrared absorption dip at a fixed wavelength | CO2, CO | Pricier, needs a warm cell, poor fit for NO2 |
| Metal oxide (MOX) | Resistance change in a heated sensing film | VOC and gas trend detection | Non-specific, alcohol interferes, power hungry |
| Chemiluminescence | Light from a chemical reaction with NO | Reference NOx | Reference-grade only, reagent and service load |
| UV photometry | Absorption of ultraviolet light by ozone | Reference ozone | Reference-grade, warm-up and lamp servicing |
An electrochemical sensor contains two electrodes separated by a thin electrolyte and a diffusion barrier. Nitrogen dioxide diffuses through the barrier, reacts at an electrode and the resulting current is measured against a reference electrode. The current follows a relationship close to linear with concentration over a limited range, which is why these cells work well for nitrogen dioxide, carbon monoxide and sulfur dioxide.
The catch is selectivity. An ozone cell built electrochemically also responds to nitrogen dioxide, and a carbon monoxide cell responds to hydrogen and some hydrocarbons. Manufacturers add a scrubber filter or a second correcting sensor and subtract its signal in firmware, which works reasonably until humidity or temperature pushes the cross-sensitivity off the curve it was tuned for. Forum builders on r/homeautomation hit this constantly: the hobby modules are cheap because they sit at one end of the sensitivity range, and the accurate options cost several times more.
NDIR works differently. The Beer-Lambert law says the light absorbed by a gas is proportional to concentration times path length, so a known volume of sample gas gives a clean, non-drifting number. Carbon dioxide sits on a strong band near 4.26 micrometres and carbon monoxide near 4.6, which is why NDIR became the standard for indoor CO2. Nitrogen dioxide’s bands are weak, which is why low-cost indoor CO2 monitors overwhelmingly use NDIR while NO2 nodes use electrochemical cells.
A metal oxide semiconductor sensor is the bluntest of the three. A heated tin dioxide film loses conductivity when reducing gases hit it. It responds to almost anything reactive, so it is genuinely useful as a VOC and gas trend indicator and genuinely poor as a quantitative NO2 or alcohol source discriminator.
What Environmental Factors Can Change a Sensor Reading?
- Humidity. Drives hygroscopic particle growth and shifts electrochemical and MOX baselines. The single most common cause of a node reading high on a foggy morning.
- Temperature. Scattering efficiency and reaction rates both move with it, and an enclosure heats up in direct sun. A white, shaded enclosure is not a cosmetic choice.
- Condensation and rain. Water on the inlet or inside the optical chamber scatters light on its own and can produce a spike that looks like a pollution event.
- Inlet loading. Dust, pollen, spider webs and insects in the inlet cut flow and skew the count. Scheduled cleaning is part of calibration, not upkeep.
- Airflow and placement. Near a road, a chimney or an extractor, a sensor measures that source and almost nothing else. A sensor in a sealed cabinet measures its own recirculated air.
- Power supply. Unregulated mains adapters and cheap battery rails inject noise into electrochemical current measurements, which shows up as a wandering baseline.
- Aging and poisoning. Electrochemical cells lose sensitivity over their rated life and can be poisoned by solvents, cooking oil vapour or ozone. MOX sensors drift steadily and need occasional zeroing in clean air.
- Warm-up time. Electrochemical and MOX sensors need hours, sometimes a day, to stabilise. A reading taken ten minutes after power-on is not a reading.
How Is Raw Sensor Data Turned Into an Air Quality Index?
The index is not measured. It is calculated, and the arithmetic is worth knowing because it explains most of the confusion people have with the number on a weather app.
- Concentrations are averaged over the pollutant’s reporting period. In the US that is typically a 24-hour mean for PM2.5, with hourly data used for ozone and nitrogen dioxide.
- Each pollutant gets its own sub-index by looking up where the concentration falls between two breakpoints and interpolating linearly. The sub-index is normally rounded to the nearest integer.
- The overall AQI is the maximum sub-index across pollutants, so the worst pollutant sets the headline number.
- The value is truncated to an integer and mapped to a category, a colour and a line of health advice.
Here is the US EPA PM2.5 breakpoint math worked through. A node reports a 24-hour mean of 28.4 µg/m³. Under the current breakpoints that sits between 9.1 and 35.4 µg/m³, which map to sub-index values of 51 and 100:
I = (100 – 51) / (35.4 – 9.1) × (28.4 – 9.1) + 51
That is roughly 1.86 × 19.3 + 51, which gives a PM2.5 sub-index of about 87, and therefore an AQI of 87. The same 28.4 µg/m³ would land in a different band under an older pre-2024 breakpoint set, which is why a screenshot from 2021 and a live page today can disagree about the same day.
| AQI | Category | What it means for you |
|---|---|---|
| 0 to 50 | Good | Air quality is fine for anyone. |
| 51 to 100 | Moderate | Acceptable; unusually sensitive people may react. |
| 101 to 150 | Unhealthy for sensitive groups | Children, older adults, pregnant people and those with heart or lung conditions should reduce prolonged exertion outdoors. |
| 151 to 200 | Unhealthy | Everyone should reduce long or heavy outdoor activity. |
| 201 to 300 | Very unhealthy | Health alert; the whole population should stay indoors and filter indoor air. |
| 301 to 500 | Hazardous | Emergency conditions; remain indoors with filtration. |
On the health side, the WHO 2021 guidelines set an annual PM2.5 mean of 5 µg/m³ and a 24-hour mean of 15 µg/m³. Those thresholds sit inside the US Moderate band, which is the uncomfortable part: a city can report “Moderate” air on a hundred days a year and still be over the WHO guideline for annual exposure.
How Accurate Are Low-Cost Air Quality Sensors?
Expect a well-calibrated low-cost PM2.5 node to land within roughly 20 to 30 percent of a reference monitor for mass concentration, and an electrochemical gas node to be good for trend and magnitude rather than for exact parts per billion.
Precision and accuracy are not the same thing. A sensor can be very repeatable and still sit consistently 40 percent high. What fixes that error is collocation: run the node beside a reference instrument for weeks, fit a correction against the paired data, and apply it. Networks such as Breathe London in the UK, MegaSense in Helsinki and the PurpleAir community map all treat collocation as the step that turns raw readings into usable ones.
Signs of a credible instrument are unglamorous: a stated measurement range in µg/m³ or ppb, a published response time and warm-up period, a serial number and a calibration history, humidity and temperature on the output stream, and data you can export yourself. On r/smarthome the practical priority is often exactly that last one, getting the raw data out so somebody else can check the claim. On r/molekule, owners mostly use consumer monitors as change detectors, testing a filter and watching the number fall rather than trusting an absolute number.
Sites such as r/AirQuality and r/homeautomation are full of home builds chasing PM1, PM2.5, PM10 and CO2 on a hobby budget, and the recurring lesson is that CO2 and radon need dedicated parts rather than a generic multi-pollutant module.
How Should Cities Choose and Place Air Quality Sensors?
Decide the decision first. Mapping traffic hotspots, publishing a live open map, and evaluating a low-emission zone all tolerate different errors, and the last one needs reference-grade instruments for the legal record.
Then size the grid. Dense networks earn their keep when the question is local variability, so spacing of a few hundred metres around a road corridor or a school cluster beats sparse stations spread over a whole city.
Siting rules that consistently show up in good deployments:
- Breathing height, roughly 2 to 3 metres, not at roof level and not at a kerb where vehicles crowd the inlet.
- At least two metres from any wall, corner or tree canopy that blocks airflow.
- Away from vents, chimneys, air-conditioner condensers and open windows.
- Sheltered from direct sun, with an inlet that faces the open air rather than a wall.
- Metadata recorded at deployment: height above ground, distance to road, surface type, height of nearby buildings.
Mains power beats battery wherever it is available, because battery budgeting pushes you into sampling less often, and short sampling loses peaks. If telemetry has to be wireless, LoRaWAN or cellular is more dependable than consumer Wi-Fi in street furniture. Budget for the unglamorous half: filter and inlet cleaning on a schedule, firmware updates, and a reference collocation slot in the first and twelfth months.
What Are the Limits of Air Quality Sensor Data?
A single node describes its own intake. A lamppost sensor is a point source of evidence, not a citywide average, and the difference between a kerbside node and a park node can exceed the difference between clean and polluted days.
The AQI is a communication device, not a toxicity scale. It compresses several pollutants into one number using one jurisdiction’s breakpoints, and two cities can publish different numbers for identical air.
A reading is not a diagnosis. If someone asks whether their child should go outside today, point them at their local authority’s guidance and a clinician, not at a node map.
Indoor is a different measurement problem. Outdoor regulatory networks care about combustion pollutants and secondary chemistry; indoors the interesting signals are CO2 as a ventilation proxy, VOCs from furniture and cleaning, and radon, which needs specialist detection methods.
Frequently Asked Questions
Do air quality sensors measure pollution directly?
Not quite. Most measure a physical or chemical property of the pollutant and infer a concentration from it. Optical particle counters count light-scattering events and convert to mass using an assumed particle density. Electrochemical cells measure a reaction current. The concentration is always a calibrated inference, which is why two sensors of different types can legitimately disagree.
How long does an air quality sensor take to produce a reliable reading?
Several hours at minimum, and a day is safer. Electrochemical and metal oxide sensors need a warm-up period before the baseline settles, and optical particle sensors need a few clean samples before the count histogram stabilises. On top of that, regulatory values are 24-hour averages, so a ten-second sample and a daily mean are describing different things entirely. Discard the first day of any deployment.
Can a household sensor replace an official air quality monitoring station?
No. Regulatory stations use analysers with traceable calibration, serviced regularly and audited for data capture. A low-cost node is excellent for showing where and when pollution spikes appear across a neighbourhood, and it can complement an official station, but it cannot be used for compliance, legal limits or reporting to a health authority. Treat it as a clue generator that points you toward the official record.
Why does humidity affect low-cost air quality sensor readings?
Hygroscopic salts in the aerosol absorb water vapour as relative humidity rises, so particles physically grow. An optical counter sees a larger particle, scatters more light and reports more mass than is present, which is why PM2.5 readings often climb on humid or foggy mornings with no change in emissions. Devices apply an empirical humidity correction learned during collocation, and it works reasonably well once a node has been collocated properly.
Are air quality sensors safe to use inside homes and schools?
They are safe to own and operate. The common indoor units use NDIR, metal oxide or electrochemical sensing, none of which are hazardous at the concentrations involved in normal use. Two practical cautions instead: check for a carbon monoxide alarm if you have any fuel-burning appliance, and place the sensor away from cooking vapours, cleaning sprays and solvents, which can poison an electrochemical cell and give you wrong numbers rather than a safety risk.
Start With the Reading You Want to Make
Name the pollutant and the decision it feeds. That answer points almost automatically to the sensor type, the accuracy you actually need and how many nodes the question deserves.
Then do three things before any hardware order: write down the averaging period the decision needs, work out where the nearest reference monitor sits so collocation is possible, and decide who will clean the inlet. A sensor that reports a number nobody can defend is worse than no sensor, and most of that risk comes from skipping these steps rather than from the electronics.
Once a node is running, keep the raw counts alongside the corrected concentration and publish both. Readers on forums like r/homeautomation trust a project far more when the uncorrected data sits right beside the answer.