
Building energy benchmarking works by taking a building’s measured energy use over a full 12-month period, adjusting it for weather, floor area and how the space is used, then comparing the result against similar buildings and against the building’s own past years. That comparison comes out as a number per square foot and, in the tools most US programs use, a 1 to 100 performance score. It is a measurement exercise, not an inspection.
Below is the whole process in plain language: what the inputs are, how they get turned into a score, where the data usually breaks, and what an owner or city does with the result once they have it. I have kept it tool-neutral because the same mechanics apply whether you use a free federal tool, a city portal or a paid service.
Table of Contents
- How Building Energy Benchmarking Works
- What Is Building Energy Benchmarking?
- What Data Does a Building Energy Benchmark Use?
- Energy data
- Building characteristics
- Context data
- How Building Energy Benchmarking Works From Data to Score
- How often to benchmark and when the window opens
- What Is Weather and Occupancy Normalization?
- What Do Energy Use Intensity and Benchmark Scores Mean?
- How Are Different Building Types Compared?
- Seven types of benchmarking
- What Is the Difference Between Benchmarking and an Energy Audit?
- How Do Cities and Building Owners Use Benchmarking Results?
- What happens to the data after you file
- What Are the Common Problems With Energy Benchmarking?
- Frequently Asked Questions
- What is building energy benchmarking?
- Is energy benchmarking the same as an energy audit?
- How is energy use intensity calculated?
- What is a good energy benchmark score?
- How often should a building be benchmarked?
- Conclusion
How Building Energy Benchmarking Works
Here is the short version. A benchmarking program takes one year of fuel and electricity data for a defined building boundary, normalizes it so that a cold winter or a partly empty floor does not distort the result, divides by the floor area that the program counts, and then ranks the building against a reference set. The output is energy use intensity (EUI) and, usually, a score.
Everything else is detail. The reason the process exists is that raw utility bills tell you almost nothing on their own. A 180,000 square foot office and a 40,000 square foot retail strip both cost money; without normalization you cannot tell which one is performing well.
What Is Building Energy Benchmarking?
Building energy benchmarking is a standardized comparison of a building’s energy use against a common reference, adjusted for the conditions that are outside the owner’s control. It reports performance per unit of floor area over a year, so two buildings of very different sizes can be placed side by side.
The comparison usually comes in one of two forms. Peer benchmarking lines a building up against other buildings of similar type, vintage and climate. Reference benchmarking lines it up against a modeled building built to a standard set of assumptions. Most US programs blend both.
It is also worth being clear about what benchmarking is not.
- A utility bill. A bill shows what one meter consumed and what was charged. A benchmark shows what that consumption means once floor area, weather and use are factored out.
- An energy audit. An audit investigates equipment, controls and operations in detail and produces a list of measures with estimated savings. Benchmarking produces one comparison number and no diagnosis.
- A code or performance standard. A standard sets a legal threshold. A benchmark tells you where you sit relative to peers or a model; whether that matters legally depends on your local program.
Because of that split, benchmarking usually comes first and the audit comes after, once the numbers show where the money is going.
What Data Does a Building Energy Benchmark Use?
A benchmark needs three groups of input: the energy itself, the physical description of the building, and the context in which it operated. Missing any one of them produces a number that looks authoritative and is not.
Energy data
Electricity, natural gas, steam, district chilled water and heating fuel, fuel oil, propane, and in some programs water. Each is entered by fuel and, ideally, by end use: interior lighting, exterior lighting, heating, cooling, ventilation, process loads and plug loads. Splitting end uses matters because a building that is fine on average can still have a single bad load.
The period should be 12 consecutive months. Programs increasingly accept any 12-month window you choose, which lets you avoid a period distorted by a renovation or a partial occupancy.
Building characteristics
Gross floor area, conditioned versus unconditioned space, building use type, year built, number of floors and their areas, and the type and age of major equipment. Gross floor area is the denominator for EUI and the single most common source of error.
Context data
Operating hours, occupancy or hours of use, whether the space is owner-occupied or tenanted, and the local climate station used for normalization. Where meters only cover part of the building, the rest of the energy gets estimated, and that estimate needs to be documented.
Annual totals alone are not sufficient, which surprises people. A single year cannot separate a real efficiency change from a mild winter, a tenant move-out or a change in opening hours. That is what the trend line and the normalization step are for.
How Building Energy Benchmarking Works From Data to Score
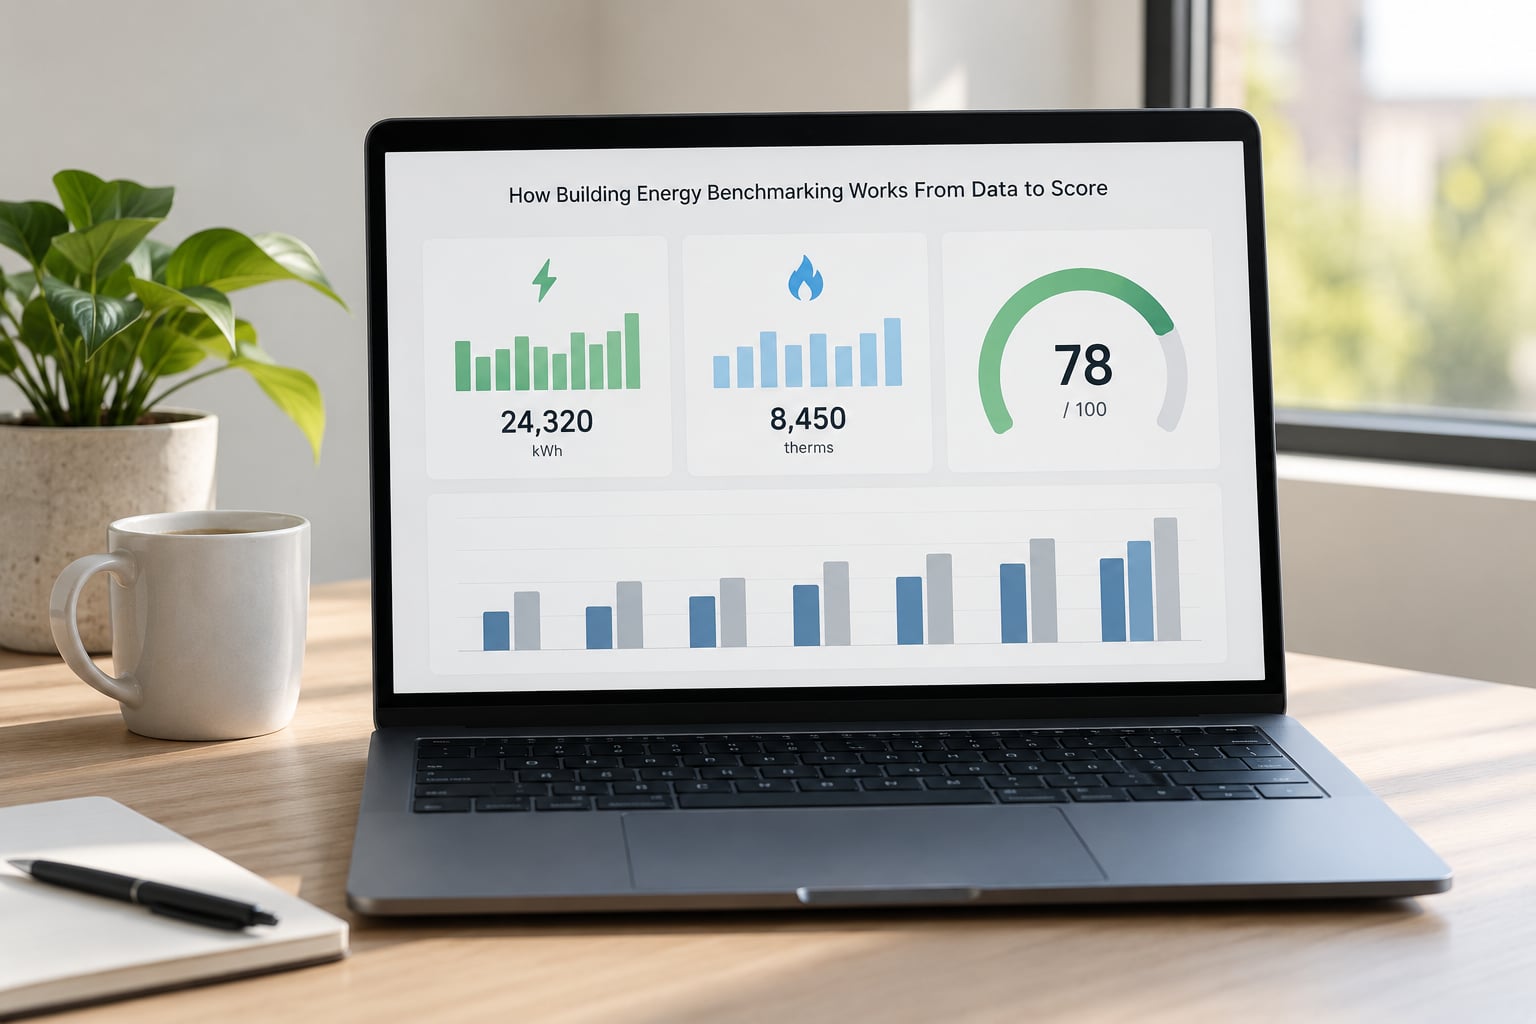
The process runs in eight stages. Each one is simple on its own, and most bad results trace back to a stage that was rushed.
| Stage | What happens | What it protects you from |
|---|---|---|
| 1. Set the boundary | Define which space and which meters belong to the building or the portfolio | Double-counting or omitting part of the property |
| 2. Collect the data | Gather a full 12 months of bills for every fuel and, where possible, meter-level detail | Gaps, partial years and estimated values |
| 3. Build the profile | Enter floor area, use type, year built, occupancy and operating hours | A comparison against the wrong peer set |
| 4. Validate | Check that totals match bills, that meters map to the right space, and that estimates are flagged | A precise-looking score built on wrong inputs |
| 5. Calculate energy use | Convert every fuel to a common measure and total annual consumption | Comparing kWh to therms as if they were the same |
| 6. Normalize | Adjust for weather, hours of operation and use | Being rewarded or punished for the weather |
| 7. Score and compare | Compute EUI, assign a score or band, compare with peers and prior years | Reading one number as if it were a grade |
| 8. Report and act | File with the program by the deadline and turn gaps into a work list | Filing on time and then doing nothing with it |
Stage 4 is where people lose time. Comparing the meter total in the tool against the account total on the bill, on the same basis, catches most transcription errors before they become a normalized score.
How often to benchmark and when the window opens
The cycle is annual, and it is driven by two dates rather than one. The data period says which 12 months count, and the filing deadline says when the report has to be in. Many programs open the submission window a few months before the deadline, and some cities now offer interim checks that let you validate the data before the filing date rather than after it.
Run the data pull a quarter before the window opens, not inside it. Utility accounts close slowly, and a bill that arrives in the last month of the window will not have a full reading. Any period you choose has to be twelve consecutive months, and choosing one that matches an accounting year makes year-over-year comparison straightforward.
What Is Weather and Occupancy Normalization?
Normalization removes the effect of conditions a building did not choose. A school in a mild year uses less heating and cooling than in a typical year; without an adjustment, the mild year looks like an efficiency win. A retail store open 16 hours a day should not be judged against one open 8 hours.
Weather normalization adjusts for heating and cooling degree days against a standard climate period for the building’s location. A mild year is pushed back up, a harsh year is pulled down, so the score reflects the building rather than the forecast.
Hours-of-operation and use adjustments handle the rest. A building open longer, heated to a higher setpoint or filled with more people than the reference is credited for the extra load. Where a program’s inputs are weak, this adjustment is often just a set of rules about hours and use, which is why occupancy data still matters even when the weather data is solid.
Normalization is not free of judgment. Different tools apply different rules, so a score from one system may not line up exactly with a score from another for the same building. Use one method consistently across a portfolio or the comparison becomes noise.
What Do Energy Use Intensity and Benchmark Scores Mean?
Energy use intensity is annual energy use divided by floor area, reported in kBtu per square foot per year. A building using 300,000 kBtu over 100,000 square feet has a site EUI of 30 kBtu/sf/yr.
Two versions matter. Site EUI counts energy as delivered to the building. Source EUI adds the energy used to produce and deliver that fuel at the source, which is typically a much higher number because generation and grid losses are added back in. Source EUI is the better basis for comparing buildings in different climates and for thinking about emissions.
| Metric | What it divides | What it includes | Use it for |
|---|---|---|---|
| Site EUI | Total annual energy by gross floor area | Fuel delivered to the site | Comparing similar buildings in the same climate |
| Source EUI | Same division, upstream losses added back | Generation, transmission and distribution losses | Cross-region comparison and emissions work |
| Score | Not a division, a percentile rank | Normalizes use against a reference set first | Quick ranking and disclosure thresholds |
A score is not a grade you pass. It is a percentile position inside a reference set, so it only means something relative to the set and the method used. In US federal tools the scale runs from 1 to 100, where 26 sits roughly at the national median for office buildings and 75 marks the top quartile. That median is specific to that set; do not carry it over to a hospital in a hot climate.
Lower EUI is generally better because it means less energy for the same service. There is no single EUI number that is right for every property. A data center, a hospital and a warehouse are different buildings doing different work, and comparing them on one threshold tells you nothing useful.
How Are Different Building Types Compared?
Comparison only works inside a peer set that behaves the same way. Office, multifamily, school, retail and industrial buildings each need a reference model built around their own operating pattern.
| Building type | Factors that dominate the energy use | What the comparison gets wrong |
|---|---|---|
| Office | Hours, density, plug loads, HVAC schedule, window type | A half-empty floor treated as a full one |
| Multifamily | Units and bedrooms, corridor and common-area loads, individual unit behaviour | Whole-building data used where tenant data is required |
| School | Age ranges, calendar hours, summer use, ventilation requirements | Summer months counted as a normal operating year |
| Retail | Long trading hours, refrigeration, display lighting, inventory density | An office operating profile applied to a store open late |
| Industrial and warehouse | Process loads, ventilation, refrigeration, dock and yard equipment | Square footage used where floor area alone ignores process intensity |
This is the practical reason a good program insists on use type, year built and hours of use before it returns a result. Change any of those inputs and the score can move by double digits without a single physical change to the building.
Seven types of benchmarking
Seven approaches get grouped under this one name, and describing them separately avoids confusion later:
- Peer comparison against similar buildings of the same type, vintage and climate.
- Historical comparison of the building against its own previous years, which is usually the only trend that reflects your own decisions.
- Reference or model-based comparison against a simulated building built to standard assumptions.
- Whole-building versus end-use reporting, where the first uses one total per fuel and the second separates lighting, heating, cooling and plug loads.
- Site versus source accounting, which differ on what they charge to the building.
- Mandatory versus voluntary programs, where the same data is filed under a local ordinance or kept internal for planning.
- Portfolio-level benchmarking, which scores many properties together so the strongest set the bar for the weakest.
What Is the Difference Between Benchmarking and an Energy Audit?
Benchmarking measures and compares. An audit investigates and diagnoses. A benchmark tells you a 120,000 square foot warehouse uses twice the energy of comparable buildings; an audit finds which systems and schedules produced that number and what to change about them.
| Question | Energy benchmarking | Energy audit |
|---|---|---|
| Question answered | How does this building compare? | Why does it use this much, and what would reduce it? |
| Scope | The whole building, one fuel total per period | Selected systems, end uses and controls |
| Method | Bill and meter data plus building characteristics | Walkthrough, measurement, sometimes instrumentation and modeling |
| Output | EUI, score, peer position, trend line | List of measures with estimated savings and cost |
| How often | Annually | Every few years, or after a major change |
| Relationship | Tells you which buildings deserve an audit | Supplies the detail the benchmark was missing |
Used in sequence they cover each other. The benchmark narrows a portfolio down to the few buildings worth attention; the audit turns that attention into a retrofit list; the next benchmark round verifies whether the work delivered.
How Do Cities and Building Owners Use Benchmarking Results?
Disclosure and ranking. Cities publish the results, which lets owners find under-performing neighbours and lets the public ask why two similar buildings differ. Owners use the same peer view internally to decide where a portfolio is weak.
Performance requirements. Some programs use the score as a trigger: a building below a threshold has to submit a plan, get an audit or correct the record by a set date. The threshold is set locally, so the same score can be fine in one jurisdiction and a violation in another.
Capital planning. A retrofit priority list built on benchmark data starts from evidence rather than intuition. A building with heating load far above its peer group is a different conversation from one that is merely large.
Operations. The trend line catches what the score hides: a chiller running overnight, a schedule that never changed after hours were cut, a ventilation damper stuck in place.
Verification. After a retrofit or an efficiency program, the next benchmark period is the test. Savings claims from a contractor should show up in the annual numbers, and a building whose score does not move deserves a look at how the data was entered.
What happens to the data after you file
Most cities publish aggregated benchmarking data through an open portal, and that is the part of the process owners underuse. Once your building’s record is public, you can pull comparable buildings in the same district and look at how the distribution is moving, which tells you whether a mid-range score is normal for the area or quietly poor. For anyone building a city energy dashboard or a tenant-facing tool, that published dataset is the raw material, and it is far cheaper than collecting your own.
Two cautions apply to any public dataset. Coverage is uneven, so older records and smaller buildings may be missing or estimated rather than metered. And published figures are rounded or suppressed at low thresholds, which is worth knowing before you model anything on top of them.
What Are the Common Problems With Energy Benchmarking?
Almost every unreliable benchmark comes down to an input error, not a calculation error. The tool does the arithmetic; the operator decides whether the arithmetic means anything.
| Problem | Effect on the result | Fix |
|---|---|---|
| Incomplete 12-month data | An annual total built from part-year values understates use | Use the largest consecutive 12-month block available and flag any gap |
| Wrong gross floor area | The denominator is wrong, so EUI and score are wrong | Reconcile the area against the property record or a measured plan |
| Missing fuel account | One fuel is absent while the area is unchanged | List every account serving the boundary, including submeters and shared meters |
| Inconsistent boundary between years | Trend line shows a change that is really a redefinition | Keep the boundary fixed, or restate prior years on the new boundary |
| Meter-to-building mapping errors | One building carries another’s load, or common areas are counted twice | Map every meter to a space and confirm shared meters once |
| Occupancy and hours errors | Normalization credits or penalises a load that was never there | Record actual hours of use and occupancy by period |
| Confusing modeled with measured results | A modeled estimate is read as a meter reading | Label estimated values and keep measured data in a separate field |
Multi-tenant buildings add their own version of these problems. Where the owner does not see tenant bills or tenant submeters, the honest options are whole-building data with the tenant spaces included, or an agreed method for estimating them. Whichever route is used, the method has to be documented, because the score changes with it.
Manual entry is the other recurring complaint, and it is a real one. Teams with a handful of buildings manage it. Teams with dozens report that spreadsheets and automated meter feeds are the difference between a month of work and a week, and that data preservation matters more than usual given ongoing discussion about the long-term status of the federal benchmarking tool. Exporting your benchmark history regularly is cheap insurance.
Frequently Asked Questions
What is building energy benchmarking?
It is a standardized way to compare a building’s energy performance with similar buildings or with a reference model. The process adjusts for floor area, weather, building type and operating hours, then reports energy use intensity and, in most US programs, a 1 to 100 score. It measures and compares; it does not diagnose equipment or propose fixes.
Is energy benchmarking the same as an energy audit?
No. Benchmarking tracks overall energy-use intensity and performance over time, usually once a year, using bills and building characteristics. An audit investigates specific systems, equipment, controls and operational problems in much greater detail and returns a list of measures with estimated savings. Benchmarking tells you which buildings deserve an audit; the audit supplies the detail.
How is energy use intensity calculated?
Energy use intensity is annual energy consumption divided by floor area, usually reported in kBtu per square foot per year. Site EUI uses energy as delivered to the building. Source EUI adds the energy used to generate and deliver it. A building consuming 300,000 kBtu over 100,000 square feet has a site EUI of 30 kBtu per square foot per year.
What is a good energy benchmark score?
There is no single good score for every property. A strong result depends on building type, climate, use, fuel mix and comparison method. In US federal tools a score of 26 is roughly the national median for office buildings and 75 marks the top quartile, but those figures describe that reference set only. The most useful benchmark places your building against genuinely similar peers.
How often should a building be benchmarked?
Annually, over a rolling 12-month period, with the report filed by a deadline set by your local program. Annual cycles matter because a single year cannot separate a real efficiency change from a mild winter or a change in occupancy. Portfolio teams that cannot do this by hand usually schedule automated meter or bill feeds into the reporting tool.
Conclusion
The first practical move is unglamorous: collect a complete 12 months of data for every fuel that serves the building, write down exactly which space and which meters are in scope, and check that the floor area you are using matches the record. Everything downstream, including how building energy benchmarking works as a score or an intensity figure, depends on those three things being right.
Once the inputs are clean, interpret the result the same way each time. Compare the building with its own previous years and with a genuinely similar peer set, and treat the score as a position rather than a verdict. That comparison is what turns a reporting obligation into a list of things worth fixing next.