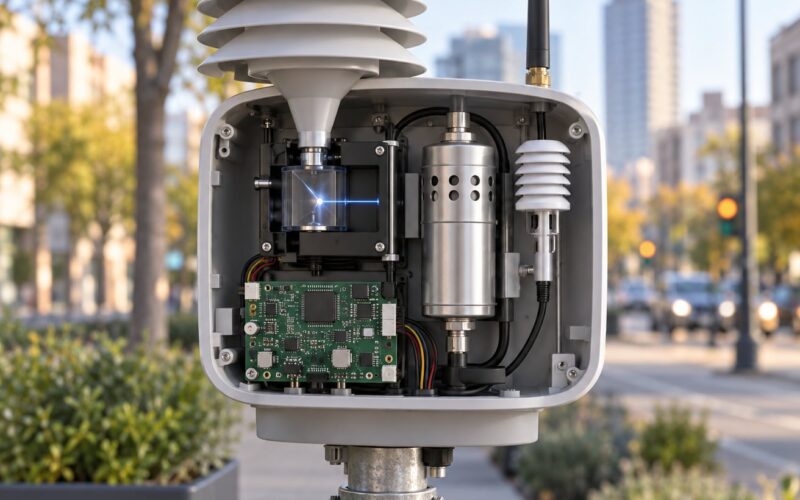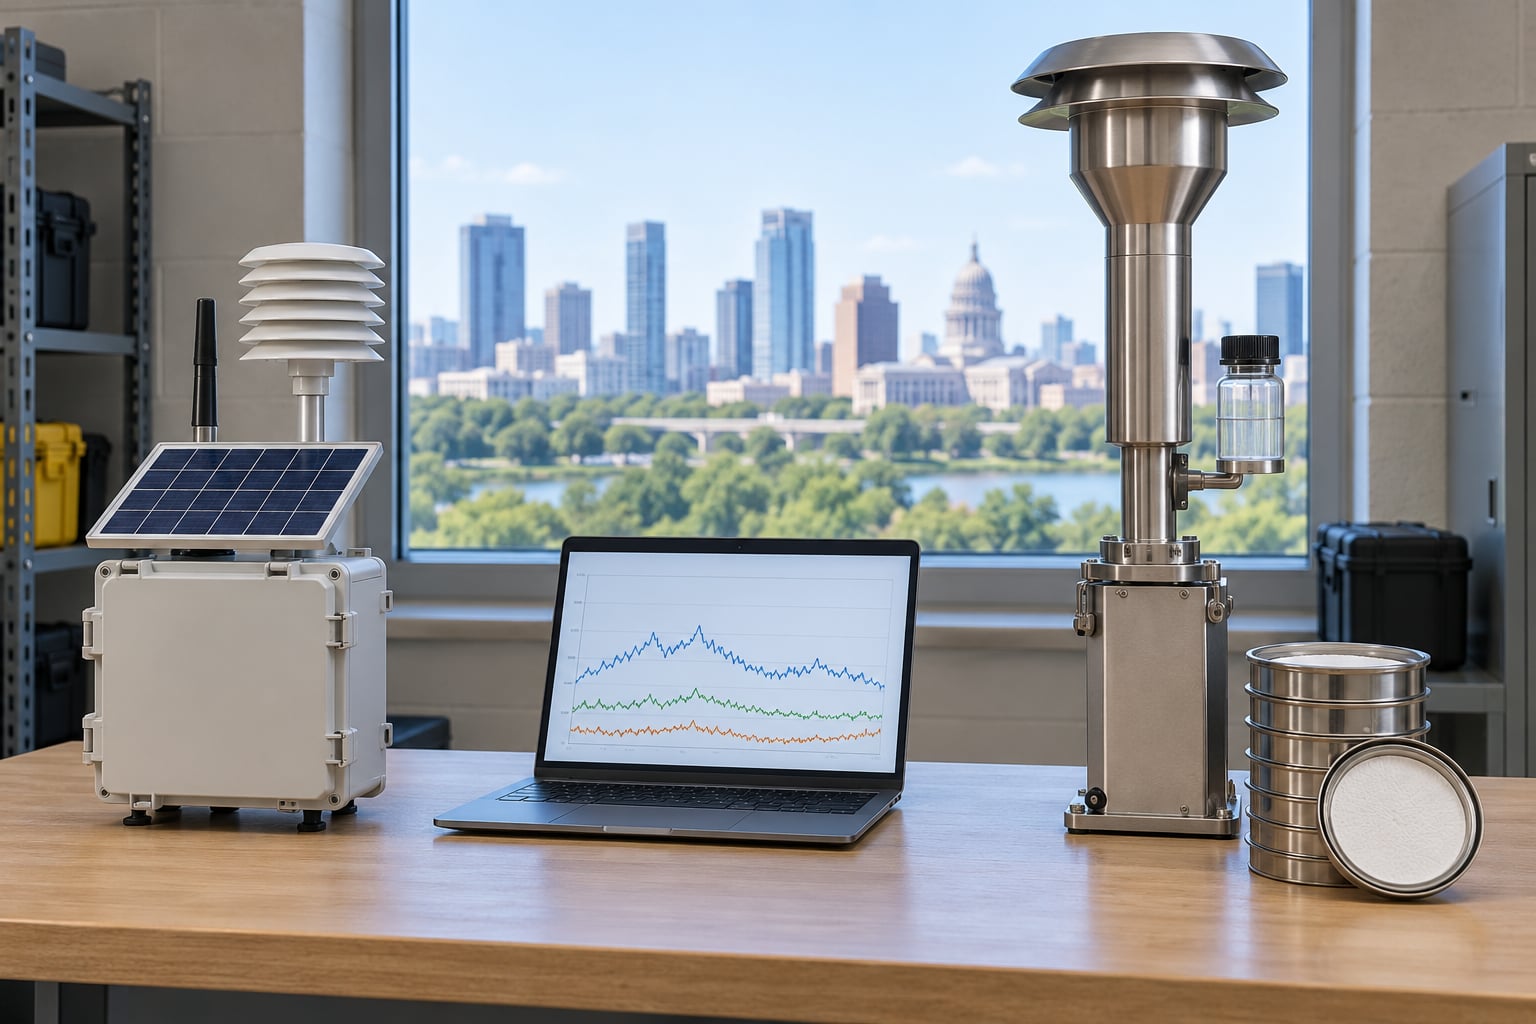
Low cost air sensors and regulatory reference monitors measure different things, so they are not really competitors. A network sensor is cheap enough to place on every block, tracks pollution trends and hotspots well, and can be corrected against a reference unit. A reference monitor is the legal instrument for compliance reporting, and nothing replaces it when a number has to stand up in court.
The gap comes from physics, not from sloppy manufacturing. Reference instruments weigh the mass of particulate matter collected on a filter. Low cost sensors infer a concentration from light scatter, infrared absorption or a change in electrical resistance, then convert that signal using assumptions about particle density and composition. When the air is humid, or when the particles are a different mix than the sensor expects, those assumptions break and readings drift.
So the useful question for a city program is not which device is more accurate. It is which decisions each device is allowed to influence. This guide walks through the physics, the quantified error ranges, the calibration protocol and the hybrid network design that most city programs end up running. Guidance is current as of 2026.
Table of Contents
- How Low Cost Air Sensors Compare to Reference Monitors at a Glance
- Glossary of terms used throughout this guide
- What Is the Difference Between a Low Cost Sensor and a Reference Monitor?
- Why this is not a quality ranking
- How Accurate Are Low Cost Air Sensors?
- What field studies actually found
- How to read R2, RMSE and mean bias in that order
- Humidity and temperature are the biggest source of disagreement
- Which Pollutants Can Each Device Measure?
- Direct measurement versus proxy estimation
- How Do Low Cost Sensors and Reference Monitors Perform Over Time?
- Sampling interval and what you can see
- Drift and calibration cadence
- Data gaps are a monitoring strategy in themselves
- What Does a City Need From Each Type of Monitor?
- How Much Do Low Cost Sensors Cost Compared With Reference Monitors?
- How Should Cities Choose a Monitoring Strategy?
- A six-step decision framework
- How to run a collocation and read the result
- Reading the PurpleAir and US EPA correction
- What Are the Main Limitations of Using Low Cost Sensors?
- Telling a real event from an artifact
- Where Do Reference Monitors Still Win?
- What Does a Hybrid Low Cost Sensor Network Look Like?
- Building it in four moves
- Keeping the data yours
- Frequently Asked Questions
- Can low cost air sensors replace reference monitors?
- How accurate are low cost air quality sensors compared to reference monitors?
- Are PurpleAir sensors accurate enough to trust?
- How do I calibrate a low cost air quality sensor?
- How many low cost sensors does a city need?
- Why do my sensor readings differ from the official AQI?
- Conclusion
How Low Cost Air Sensors Compare to Reference Monitors at a Glance
They differ on measurement principle, cost structure, regulatory standing and data quality, and they agree closely on temporal patterns. The table below covers the criteria that decide a purchasing or siting decision.
| Criterion | Low cost sensor | Reference monitor (FRM/FEM) |
|---|---|---|
| Measurement principle | Indirect: light scattering, infrared absorption, resistance change | Direct: gravimetric filter mass, reference spectroscopy |
| Typical PM2.5 error vs reference | Commonly 10-40% different before correction; humidity drives most of the gap | Defined by the method and its uncertainty, set by the regulatory standard |
| Correlation (R2) seen in field studies | Ranges from under 1% to over 75% depending on unit, season and site | Not a meaningful metric; the method is the standard |
| CO2 accuracy after fresh-air calibration | Within roughly 50-80 ppm of a reference instrument | Tight tolerance defined by the reference method |
| Pollutants measured | PM1.0/PM2.5/PM10, CO2, VOC index, temperature, humidity | All six criteria pollutants plus reference methods for each |
| Spatial coverage per deployment dollar | Hundreds to thousands of nodes | A handful of sites |
| Sampling interval | Seconds to minutes | Typically hourly, some continuous methods sub-minute |
| Calibration | Regular collocation or a published correction equation | Calibration and audit schedules defined in the quality assurance plan |
| Maintenance | Cleaning, firmware, enclosure, battery or mains power, replacement units | Scheduled by the agency, with documented audits and chain of custody |
| Regulatory status | Screening and trend data only | The basis for AQI reporting and attainment decisions |
| Best use case | Neighborhood mapping, hotspot discovery, dashboards, policy evaluation | Compliance, legal evidence, long baselines, validated research |
Glossary of terms used throughout this guide
- FRM (Federal Reference Monitor): the designated instrument whose output defines the reference measurement for a criteria pollutant.
- FEM (Federal Equivalent Method): a method shown to be equivalent to the FRM, so a state agency may use it for regulatory reporting.
- Collocation: operating a low cost sensor at the same inlet and time window as a reference instrument, usually at an NCOR or state site.
- Nephelometer / optical particle counter: a light-scattering sensor that counts particles and estimates their mass.
- NDIR: non-dispersive infrared sensing, the standard approach for CO2 and used by some trace-gas instruments.
- MOx: metal oxide semiconductor sensing, the cheap and fragile way to read VOCs.
- R2, RMSE, mean bias: correlation strength, root-mean-square error, and average signed error. Read all three, in that order.
What Is the Difference Between a Low Cost Sensor and a Reference Monitor?
A reference monitor is an FRM or FEM instrument that measures particulate matter by weighing what collects on a filter, and measures trace gases by reference spectroscopy. It is the legally recognised basis for compliance decisions, attainment designations and the public AQI.
Particulate matter is where the two classes diverge most sharply. The reference method draws a known volume of air through a filter over 24 hours and reports the change in filter weight, converted to micrograms per cubic metre. Nothing sits in between: no assumption about particle density, shape, refractive index or composition enters that number.
A low cost sensor does not weigh anything. It shines light into a chamber, counts scattering events, and divides that count into size bins. To print a µg/m³ figure it has to assume the particles look a certain way. Change the assumptions and the printed number changes, even though the air did not.
Why this is not a quality ranking
Nobody sensible is arguing that a cheap sensor should be as good as a reference monitor at measuring the mass of PM2.5. It will never be. The question is whether it needs to be for the job you have in mind, and for anything about spatial patterns, a hundred cheap nodes will beat one reference instrument every single time.
As Dr Ruaraidh Dobson put it in a Local Haze interview, ultra-low-cost instruments will never replace reference monitors because they cannot provide the data a gravimetric instrument produces. In the same interview he makes the complementary point: the value of a network is the pattern it reveals, and error in individual nodes averages out across a large deployment.
That self-averaging effect is underused. A single node with a 30% humidity bias is not very useful. Two hundred nodes with independent biases produce a field-level average where much of that error cancels, which is why network design matters more than any individual correction equation.
How Accurate Are Low Cost Air Sensors?
They are accurate enough for trends and ranking, and not accurate enough for compliance. Published field evaluations place uncorrected PM2.5 readings commonly 10-40% away from reference values, with the sign of the error usually positive, meaning the sensor reads high.
It helps to separate four words that get used interchangeably. Accuracy is closeness to truth. Precision is repeatability. Correlation is whether two series rise and fall together. Error is the gap between a reading and the truth. A sensor can correlate at R2 = 0.95 with a reference while reading 40% high, and that is the normal case for a good PM sensor.
What field studies actually found
Ko and colleagues evaluated PurpleAir PA-II units in a real-world environment and found the units overestimating PM2.5 against reference monitors. Across the wider literature the correlation coefficient ranges wildly, from under 1% in one poor deployment to over 75% in a well-characterised one, with Datta and colleagues reporting that spread directly. A number like R2 = 0.30 is not a failure of the hardware. It reflects the site, the season, the humidity range and whether the unit was ever collocated.
How to read R2, RMSE and mean bias in that order
R2 tells you whether the sensor tracks the reference at all. It says nothing about whether the number is right, so a high R2 with a large bias is a common and confusing outcome. RMSE tells you the typical size of the miss in concentration units. Mean bias, the average signed difference, tells you the direction and therefore whether a correction is even possible.
Out-of-sample performance matters more than the headline fit. If you fit a correction on the same weeks you report it on, you have measured your own curve, not the sensor. Split the dataset, fit on one half, report error on the other, and the number that matters is usually the less flattering one.
Humidity and temperature are the biggest source of disagreement
Relative humidity above roughly 60% makes optical PM sensors read high, because water droplets in the air scatter light and inflate the particle count. Summer humidity in most US cities sits in that range for much of the year. A correction that works in a dry Denver January will undercorrect in a humid August in Atlanta.
Temperature affects the light source, the electronics and the airflow path. Long-time PurpleAir owners report on community forums that the onboard temperature sensor is fixed at the factory and cannot be recalibrated, so outdoor readings shift with the weather and the reported concentration drifts with it. The sensor still tracks changes. The absolute value is the part that needs a correction.
Which Pollutants Can Each Device Measure?
Low cost sensors cover particulate matter, CO2 and a VOC index. Reference monitors cover all six criteria pollutants with defined methods. The gap is widest for the trace gases that health standards are written against.
- PM2.5, PM10, PM1.0: both classes measure it. The sensor estimates mass from particle count and size, the reference monitor weighs it.
- CO2: low cost NDIR sensors are genuinely good here, typically within 50-80 ppm of a reference after a fresh-air baseline calibration.
- NO2: the hardest case. Dobson notes that roughly 30 ppb near a road is about 10,000 times harder to sense than 428 ppm of CO2, because NDIR at that concentration runs into a punishing signal-to-noise problem and photoacoustic sensing stays in the lab.
- Ozone: the same physics limit applies, and MOx cross-reactivity makes a cheap ozone reading largely a VOC reading in disguise.
- SO2 and CO: electrochemical cells exist for both at modest cost but drift and cross-react, and they are rarely the reason a city buys sensors.
- VOCs: a low cost MOx sensor returns a unitless index, not a concentration. Useful for spotting a wood fire or a solvent release, useless for reporting a number in micrograms per cubic metre.
Direct measurement versus proxy estimation
Ask one question of any reading: does the instrument measure this quantity, or infer it from something else? A nephelometer infers mass. An NDIR CO2 sensor measures a gas that has a strong absorption line. A VOC index infers a mixture. Reference instruments do the second kind of measurement for the pollutants that regulations name, which is why only they can produce a defensible concentration.
How Do Low Cost Sensors and Reference Monitors Perform Over Time?
Reference monitors hold their specification for years under a documented quality assurance plan. Low cost sensors drift, wear out and need attention on a scale of months, and that maintenance load, not accuracy, is what usually kills a community network.
Sampling interval and what you can see
Sensors report every second or minute, so short-lived events like a rush-hour spike or a neighbour burning wood show up clearly. A reference monitor reporting hourly averages smooths those spikes away. For peak exposure questions, the high-frequency network is the better instrument, even though each reading is less trustworthy than the hourly average.
Drift and calibration cadence
Optical PM sensors drift slowly and usually need a full correction cycle each season. NDIR CO2 sensors need a fresh-air baseline when they read a fixed offset from a known outdoor value, and CO2 sensors drift noticeably over a couple of years. MOx VOC sensors are the least stable of the three and are usually replaced rather than calibrated. Reference monitors have scheduled calibrations, audits and intercomparisons with documented tolerances.
Data gaps are a monitoring strategy in themselves
The honest failure mode for a sensor network is not drift, it is silence. A unit loses power, a vendor shuts down a cloud service, an enclosure fills with spider webs and nobody notices for four months. Volunteer-run networks report this as their hardest problem, consistently, more often than buying the hardware. Reference monitors have institutional maintenance behind them, which is a genuine advantage even before you count accuracy.
What Does a City Need From Each Type of Monitor?
A city needs reference monitors for decisions with legal weight and sensors for decisions about place. Match the device to the decision, and most arguments about which is better disappear.
| Use case | Recommended device | Why |
|---|---|---|
| Neighborhood mapping | Low cost sensor network | No reference network has the density, and density is the point |
| Hotspot detection (traffic, construction, cooking) | Low cost sensor network | Minute-level resolution finds events hourly averages erase |
| Trend tracking over years | Both, together | Sensors show change; reference sites anchor the baseline |
| Public-facing alert thresholds | Reference monitor, or sensor only as a prompt to check | Publishing an AQI that later proves wrong costs credibility |
| Clean Air Action Plan evaluation | Sensors, calibrated against reference sites | Shows where a policy worked, at a fraction of the siting cost |
| Regulatory compliance or enforcement | Reference monitor only | Low cost data has no legal standing |
| Exposure epidemiology and health research | Reference monitor | Personal and cohort exposure models need validated concentrations |
| Emergency response and wildfire smoke | Sensors for situational picture, reference sites for the official number | Coverage beats precision when you need the whole region fast |
| School and indoor air quality | Low cost sensor | The question is ventilation and exposure patterns, not compliance |
How Much Do Low Cost Sensors Cost Compared With Reference Monitors?
Reference monitors cost several orders of magnitude more per site, and low cost sensors are not a cheaper version of the same thing. Comparing the two on hardware cost alone is a category error, so the honest comparison is cost per validated data point.
Categories that matter for a low cost deployment:
- Device and enclosure, including weatherproofing and mounting hardware.
- Power, mains, solar or battery, plus the labour to run cable.
- Connectivity, cellular data plan, gateway or site-to-site networking.
- Hosting and software, dashboard, database, alert rules, mapping.
- Field labour, cleaning, anti-spider treatment, battery swaps, site visits.
- Replacement, since PM modules and MOx sensors are consumables with a finite life.
- Calibration work, including staff time for collocation studies and applying corrections.
A reference monitor adds siting, shelter, a power infrastructure audit, certified calibration, scheduled maintenance and the agency overhead that produces a defensible number. The hardware is the smaller part of that bill.
The metric that actually budgets a program is cost per validated data point. Divide total annual programme cost by the number of hours that survive a QA filter. On that basis a sensor network is extraordinarily efficient for trend work and poor for compliance, because a high fraction of raw sensor hours get discarded during cleaning and correction. Treat the figures as typical US ranges that vary by region and change over time, and get a current quote before budgeting.
How Should Cities Choose a Monitoring Strategy?
Start with the decision, not the hardware. Define the question the data must answer, then work down through the steps below.
A six-step decision framework
- Write the decision down. If the sentence ends in an enforcement action, an AQI publication or a health claim, you need reference instruments.
- Classify each site. Anchor site, corroboration site or community node. The three roles have different acceptance thresholds.
- Set numeric thresholds. Decide the maximum acceptable RMSE and the maximum bias before collecting data, not after.
- Run a collocation study. Every device type and every enclosure gets compared against a reference instrument on real air.
- Document the correction. Publish the equation, the training period and the out-of-sample error.
- Validate before public release. Flag data, remove failed units, and re-check corrections each season.
How to run a collocation and read the result
Find the nearest NCOR or state site, request access, and mount the sensor at the reference inlet height within a few metres. Run it long enough to cover the humidity and temperature range you care about, ideally across seasons rather than one dry spell. Compare hourly values, because the reference monitor’s reporting interval defines your comparison granularity. Fit the regression, then hold out part of the data and report the error on the held-out portion. Anything that only works in-sample has not been validated.
Reading the PurpleAir and US EPA correction
The correction relationship published by Barkjohn and colleagues at the US EPA maps uncorrected PurpleAir readings onto the reference scale for a specific sensor and a specific relative-humidity range. It is a genuine improvement, and it does not fix everything. It cannot repair a sensor with a failed channel or a clogged fan, and it was not derived for a different sensor model or a different climate. Corrected values still differ from a state AQI reading because the state value comes from a different instrument, site and averaging period.
What Are the Main Limitations of Using Low Cost Sensors?
The core limitations are chemical specificity, physical assumptions, calibration burden and legal status. Any one of them is manageable. Together they define the boundary of what this hardware can be asked to do.
- Limited chemical specificity. An optical particle counter cannot tell you whether the mass is soot, salt or pollen.
- Cross-sensitivity. MOx sensors respond to multiple gases, so a VOC index moves when cleaning products change, not just when pollution does.
- Nonlinear response. Optical sensors lose sensitivity at high concentrations, exactly when a smoke event makes accuracy most valuable.
- Composition assumptions. The conversion from count to mass bakes in density and refractive index that change with season, weather and source.
- Calibration burden. A correction is local, seasonal and device-specific. Reuse it across a network and you inherit its error everywhere.
- Unit inconsistency. Counts, particle counts and µg/m³ get mixed across dashboards, and then get compared to official values as if they were the same unit.
- Silent failure. Community members recommend a simple check: the two particle channels on one unit should agree within roughly 10-15%. If they diverge, the unit needs cleaning or repair, whatever the app is reporting.
- Unsuitable for legal use. No low cost reading can support an enforcement notice, a permit violation or a medical claim.
Telling a real event from an artifact
When a reading spikes, check three things in order. Do the two particle channels agree, which separates a genuine event from a failing unit? Is relative humidity high, which points to a humidity artifact? Do neighbouring nodes show the same rise, which separates a real local plume from a one-off glitch? Community forums report readers most often confusing the second case, seeing an implausibly high value in an open park on a muggy night.
Where Do Reference Monitors Still Win?
Reference monitors win wherever a number has to survive outside the room where it was produced: regulation, litigation, long baselines and validated research.
- Regulatory decisions. Attainment designations, permit enforcement and AQI reporting all rest on FRM or FEM data.
- Legal evidence. In a dispute, an instrument with a documented QA plan and chain of custody is the only one that carries weight.
- Long-term baselines. Multi-decade trend analysis needs an instrument whose specification has not moved.
- Exposure research. Epidemiology models link concentration to health outcomes, so the concentration has to be the real one.
- Instrument intercomparisons. You cannot validate a correction without a validated instrument to validate against.
- Equivalence determinations. New methods become FEMs by formal testing against the reference. That process is the reason reference monitors still set the standard.
There is one more quiet advantage. A city’s low cost network is calibrated against those reference sites, so the strength of the reference network sets the ceiling on the quality of everything downstream.
What Does a Hybrid Low Cost Sensor Network Look Like?
A hybrid network uses a small number of reference monitors as anchors and a much larger sensor layer as the mesh between them. This is the architecture behind Breathe London, California AB 617 community monitoring programmes and most municipal open-data dashboards.
Building it in four moves
- Anchor. Place reference instruments where the questions are, and treat their data as ground truth for everything else.
- Mesh. Fill the gaps between anchors with sensors sized by the resolution you need, typically hundreds to low thousands for a mid-sized city.
- Collocate. Run a rotating subset of sensors at the anchor sites on a schedule, so drift is detected where it can be measured rather than guessed.
- Flag. Publish a quality flag with every value, and keep raw and corrected data side by side.
Escalation thresholds complete the design. Define in advance which conditions move an event from the sensor layer to the reference layer: a sustained rise past a threshold, a cluster of nodes rising together, or a complaint from a specific site. That prevents the expensive response from being triggered by one drifting unit.
Keeping the data yours
Plan for vendor risk before you deploy. Export raw data on a schedule, store it yourself, and use open protocols such as MQTT with local endpoints where you can. Forum users describe the fear of losing years of accumulated data to a platform change as one of the biggest reasons people hesitate to start, and the fix is unglamorous: back up the raw file every week and know the format.
Frequently Asked Questions
Can low cost air sensors replace reference monitors?
No. Reference monitors weigh particulate matter on a filter and trace gases by reference spectroscopy, and that measurement is the legal basis for compliance decisions and AQI reporting. Low cost sensors infer concentration from light scatter, infrared absorption or resistance change. They can support trends, hotspots and policy evaluation, but their data has no regulatory standing and should never be used for enforcement or health claims.
How accurate are low cost air quality sensors compared to reference monitors?
Uncorrected PM2.5 readings from low cost sensors commonly land 10-40% away from reference values, usually reading high, with humidity responsible for most of the gap. CO2 is the exception: NDIR sensors typically sit within 50-80 ppm of a reference instrument after a fresh-air baseline. Field correlation values range from under 1% to over 75%, which tells you more about the deployment than the hardware.
Are PurpleAir sensors accurate enough to trust?
They track changes well and they read high on PM2.5, especially in humid air. Ko and colleagues found PA-II units overestimating against reference monitors in real-world conditions. The US EPA correction relationship from Barkjohn and colleagues maps uncorrected readings onto the reference scale for that sensor and humidity range, which improves accuracy but does not repair a failing unit or transfer to a different sensor or climate.
How do I calibrate a low cost air quality sensor?
Collocate it with a reference monitor at the same inlet and compare hourly values, then fit a correction equation from the collocation data. Hold out part of the dataset and report the error on that held-out portion, because in-sample fits flatter themselves. Re-check the correction each season, since a curve fitted to a dry winter will undercorrect in a humid summer. Record the equation and the training period with the published data.
How many low cost sensors does a city need?
Enough to resolve the geography of your question, and that number depends on the spatial scale you are trying to distinguish. Across a large network, individual node errors partly cancel, which is the statistical argument for density. The practical drivers are budget for maintenance and hosting, and siting rules such as breathing height and distance from obstructions, not the sensor count on the reference layer.
Why do my sensor readings differ from the official AQI?
Three reasons usually. The official value comes from a reference instrument while yours is an estimate with an assumed particle density. Corrections differ between platforms, so a corrected reading and an uncorrected reading can both be in circulation. And averaging periods differ, since a rolling app average is not the same window as the official hourly or 24-hour figure. Compare like with like before deciding either source is wrong.
Conclusion
Low cost air sensors win on coverage, cost per validated data point and the ability to show which block is dirty; reference monitors win on absolute accuracy, traceability and anything that has to stand up as evidence. Decide what question you are trying to answer, and the answer usually becomes obvious. If the honest reply is that you need both, anchor a few reference monitors and fill the space between them with a well-maintained sensor mesh.