Lidar maps a city by timing laser pulses that bounce off roads, buildings, trees and terrain, then turning millions of those returns into a georeferenced point cloud of real three-dimensional shape. Cities use that point cloud to measure ground shape, extract building footprints, model drainage, inventory assets and monitor construction change, and much of it is already sitting in public data portals for free.
The interesting part is what happens after the pulse returns. A municipal survey moves from survey design through point-cloud processing to a finished map that a public works office actually opens in software, and the whole chain is documented well enough that you can follow it. This is written for developers, urban innovation teams and curious residents who want the mechanics rather than a sensor spec sheet.
Table of Contents
- How Cities Use Lidar for Mapping
- What Can Lidar Map in a City?
- How Does Lidar Mapping Work?
- How Cities Use Lidar for Mapping in Practice
- Airborne, Mobile, and Terrestrial Lidar
- How Accurate Is Lidar Mapping for City Projects?
- What Are the Main Challenges and Limitations?
- How Cities Turn Lidar Data into Useful Maps
- Frequently Asked Questions
- Is lidar better than satellite imagery for city mapping?
- Can lidar mapping see underground utilities?
- What does a city receive after a lidar survey?
- How often do cities need to remap with lidar?
- How can I see a lidar map for my city?
- Does lidar work at night and in bad weather?
- Conclusion
How Cities Use Lidar for Mapping
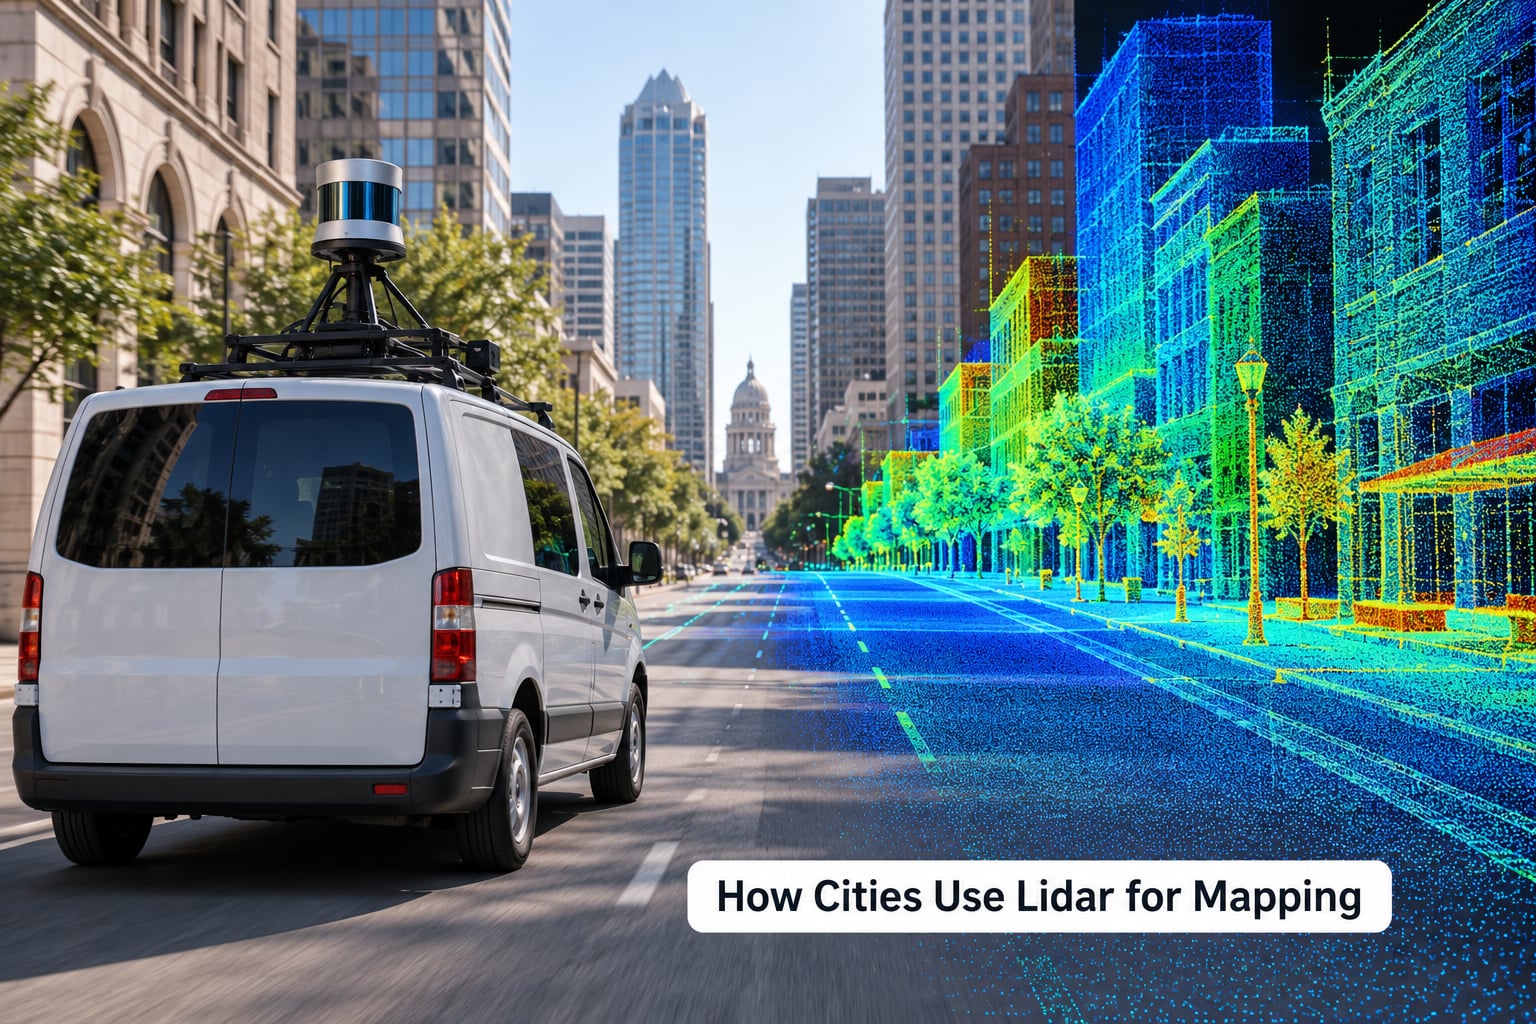
Lidar stands for light detection and ranging. A sensor emits a short burst of laser light, a photodetector measures how long the return takes, and that flight time converts to a distance. Pair each distance with a GPS position and an inertial measurement unit for orientation, and you get a coordinate for every single return.
The output is a point cloud: millions of X, Y and Z values describing the shape of everything the laser touched. Because the measurement is active rather than passive, it works in low light and produces direct elevation measurements rather than inferred shapes.
The big reason cities commission lidar instead of walking every site with a tape and a total station comes down to coverage economics. A crew can measure a few hundred features a day, and every one of those measurements is a number someone typed in. A lidar flight covers a whole county in a day, and it captures features nobody thought to measure.
Three collection methods dominate municipal work:
- Airborne lidar flies a sensor over the city on a fixed-wing aircraft or helicopter, giving wide coverage at consistent point density.
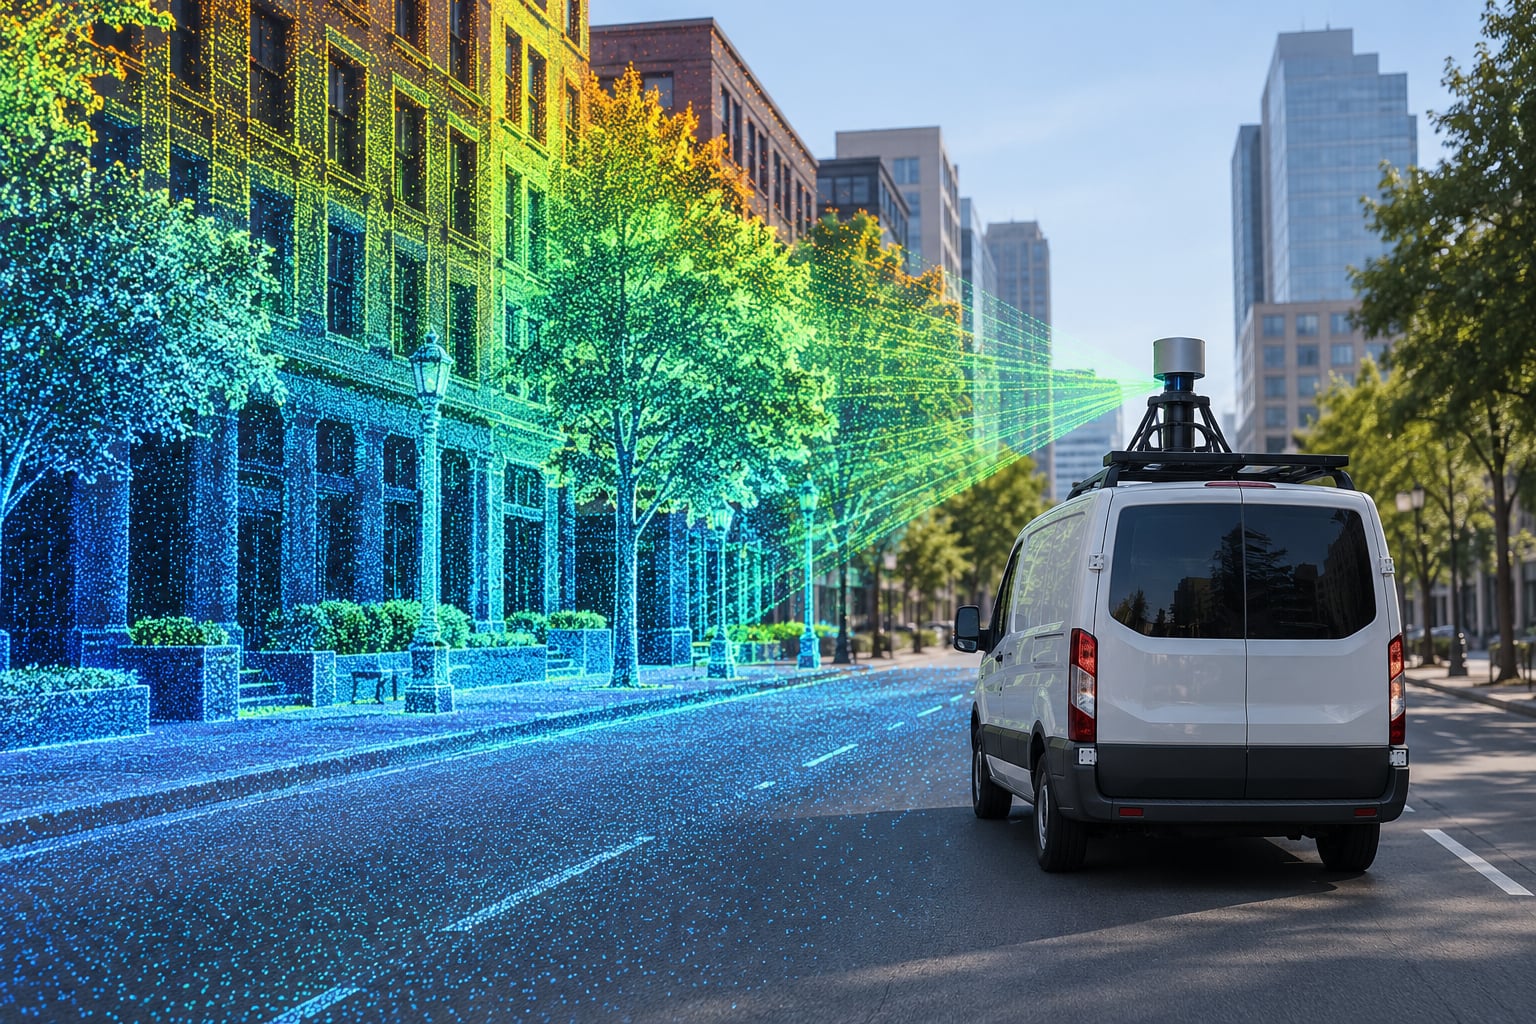
- Mobile lidar mounts sensors on a vehicle or backpack rig, capturing street-level detail including facades, curbs and overhead structures.
- Terrestrial lidar sets a scanner on a tripod at a fixed point for high-detail structural scans of a bridge, building or tunnel.
Each one has blind spots. Airborne scans struggle under tree canopy and inside covered areas; mobile scans miss rooftops and anything the vehicle can’t reach; terrestrial scans capture one viewpoint and need someone to walk around the object with the tripod.
What Can Lidar Map in a City?
Terrain and ground shape come first. Lidar is one of the few methods that separates bare earth from everything sitting on it, which is what makes drainage and flood work possible at all.
Inside the city limits, the practical targets are these:
- Road surfaces for pavement roughness, rutting, lane markings and cross-slope.
- Buildings for footprints, heights, roof geometry and floors above ground.
- Street furniture including curbs, signs, poles, hydrants, benches and traffic signals.
- Utilities above ground such as poles, guy wires, valve housings and manhole rims.
- Vegetation for canopy height, canopy cover, individual tree position and bare-earth underneath.
- Drainage features including channels, swales, culvert ends, inlets and low points where water collects.
- Construction change by comparing a new scan against the previous one.
One reason trees matter so much is that a canopy is the hard case. Most points hit leaves, but enough of them pass through gaps to reach the ground, and the ground points are what a city needs for hydrology and grading. Every pulse helps, and leaf-off seasons give noticeably cleaner ground returns.
How Does Lidar Mapping Work?
A municipal lidar project runs in stages, and the slow parts are usually not the flying.
Design. Someone specifies the deliverable first, then the specs. Urban projects typically ask for high point density and a vertical accuracy near the ASPRS standard for urban land classification. Boundary, swath overlap and control points get locked down here.
Capture. Surveyors place ground control points, usually GPS base stations on stable monuments, so every flight line can be tied to the coordinate system the city already uses. A single check point left behind is not control.
Processing. Trajectory processing smooths the raw GPS and inertial data into a continuous flight path. Then points are classified into ground, vegetation, building, water, bridge deck and noise. That classification step is where most of the cost sits.
Quality checks. Swath overlap lets surveyors compare overlapping flight lines, and ground control points give an independent check on absolute accuracy. A project that skips this ships numbers nobody can defend in a design review.
Delivery. Files arrive as LAS or the compressed LAZ version, plus derived surfaces such as a bare-earth digital terrain model and a digital surface model showing everything standing above it. Deliverables are usually catalogued with metadata: date flown, point density, coordinate system and stated accuracy.
How Cities Use Lidar for Mapping in Practice
Public works departments use the data to prioritize resurfacing. A roughness model derived from lidar point density variation is more objective than a visual inspection, and it lets a small crew spend a month where the pavement is worst instead of driving every street.
Floodplain and stormwater staff build the terrain surface that hydrologic models run on. When that surface comes from a crew walking a few catchments, flood maps stay rough; when it comes from lidar coverage of the whole watershed, the model has something to bite on.
Urban foresters get a canopy height model that separates ground from canopy, so a block with tall trees over a low building stops being miscounted as building coverage. Philadelphia-style canopy studies have made tree planting budgets easier to defend with numbers the council can read.
Transportation planners use road geometry for curb extensions, sight-line checks and intersection design. Municipal lidar also feeds the digital twin platforms that simulate curb management, construction staging and transit priority, and it gives asset managers a defensible inventory of what they own and in what condition.
Airborne, Mobile, and Terrestrial Lidar
Each platform answers a different question, and cities usually own data from more than one.
| Platform | Best For | Covers | Typical Limits |
|---|---|---|---|
| Airborne | Citywide terrain, canopy and building footprints | Full municipality in a few flight days | Coarse detail at ground level, gaps under canopy and covered areas |
| Drone or UAV | Corridor projects, parks, campuses, rapid change detection | Tens to a few hundred acres per flight | Flight rules, battery limits, wind, shorter range than aircraft |
| Mobile (vehicle or backpack) | Facades, curbs, street furniture, pavement | Road network and pedestrian areas | Needs GNSS or SLAM to stay georeferenced, misses rooftops |
| Terrestrial (tripod) | Structures, tunnels, monuments, interior facades | One viewpoint at a time | Slow, operator-dependent, needs multiple setups |
Mobile scanners increasingly use SLAM, or simultaneous localization and mapping, which builds the point cloud from sensor motion alone when GNSS is weak. That’s what makes a backpack scan of an alley or a parking garage viable at all.
How Accurate Is Lidar Mapping for City Projects?
Urban lidar is typically specified in the range of a few centimeters vertical accuracy, often quoted around 6 to 15 cm RMSE, but that figure only means something alongside a stated quality level and point density. Accuracy figures quoted without those two qualifiers are marketing copy rather than a specification.
What actually moves the number:
- Point density — points per square meter. More points means more chances to catch a surface.
- Reflectivity and surface type — wet asphalt, dark roofing and water absorb or scatter light poorly.
- Ground conditions — snow, standing water and dense undergrowth degrade the bare-earth surface.
- Georeferencing and control — good trajectory plus well-placed control points is what separates a survey-grade result from a flyover.
- Weather at collection time — fog, rain and dust scatter pulses and cost you returns.
- Post-processing choices — how aggressively the classifier smooths the ground surface.
When you read a published dataset, check the acquisition date, the stated vertical and horizontal accuracy, the point density and the coordinate system before trusting it. A five-year-old dataset covering a rapidly growing district can be accurate and still be wrong.
What Are the Main Challenges and Limitations?
Cost is the first one. Air service, control points, processing and QA add up, which is why a shared state or regional program usually beats one city commissioning its own flight. Procurement takes months before anything is collected.
Data volume is the second. A municipal point cloud runs to tens of gigabytes uncompressed and gets painful on an ordinary laptop, and people regularly underestimate that. Forum threads about opening lidar files are full of exactly this frustration, along with the related confusion about formats: LAS and LAZ for geospatial data, E57 or PLY for some terrestrial scans, and viewers like QGIS, CloudCompare and Potree opening different subsets well.
Occlusion is the third. Airborne scans cannot see under bridges, tunnels or dense canopy edges, and mobile scans cannot see rooftops. Any analysis that assumes complete coverage needs a QA check on the gaps.
Classification failures are the fourth. Flat white roofs next to bright tree tops, dark cars under trees, and rooftop equipment all produce errors that propagate straight into canopy cover and building height totals.
Staleness is the fifth and most underrated. Cities publish, move on, and quietly serve five-year-old point clouds as if they were current.
Privacy comes up too. Street-level mobile lidar can resolve windows, fences and small features of private property. Municipal lidar is generally collected for infrastructure purposes rather than for individual surveillance, but it still deserves a clear retention and distribution policy, which a lot of cities never write down.
How Cities Turn Lidar Data into Useful Maps
The point cloud itself is almost never the end product. Cities convert it into a small set of deliverables that plug into software their staff already use.
| Data Product | What It Shows | Who Uses It |
|---|---|---|
| Point cloud (LAS/LAZ) | Every measured return in three dimensions | GIS staff, surveyors, developers |
| Digital terrain model | Bare earth with buildings and vegetation removed | Floodplain management, drainage engineering |
| Digital surface model | Everything above ground, including trees and roofs | Planning, visibility and shadow studies |
| Normalized surface model | Surface model minus terrain, isolating what stands up | Building height and canopy extraction |
| 3D city model | Buildings, roads and terrain as a navigable scene | Planning, digital twin teams, public engagement |
| Canopy height model | Vegetation height as a continuous surface | Urban forestry, sustainability targets |
| Change map | What moved between two collection dates | Code enforcement, construction monitoring |
| Elevation profiles | Cross-sections along a road or corridor | Transportation engineering, ADA review |
To look at the data yourself, start with the national and state sources. The USGS 3D Elevation Program is the largest public source of US elevation data, and state lidar programs in places like Kansas, Massachusetts, Vermont and Connecticut publish statewide coverage. Beyond that, city open data portals and regional planning agencies often host their own downloads. Formats open in QGIS with the LAS tools, in CloudCompare, or in web viewers built on Potree or 3D Tiles, which is also how you would load one into a Cesium-based page.
None of that appears in Google Maps. Street View and satellite imagery are separate capture methods, and the depth sensors in phones and tablets are far too coarse and too short-ranged for city work, even though they share the name.
Frequently Asked Questions
Is lidar better than satellite imagery for city mapping?
No single method wins every job. Lidar gives direct elevation measurements and separates bare earth from vegetation, which is what drainage, grading and canopy work require. Satellite and aerial imagery give color, texture and broad, frequent regional coverage, and photogrammetry from imagery produces cheaper 3D surfaces in open, low-canopy areas. Cities commonly hold both and use each where it fits.
Can lidar mapping see underground utilities?
No. Lidar measures surfaces, so buried pipes, cables and foundations never appear in the data. It does map above-ground utility assets such as poles, guy wires, valve housings and manhole rims, plus visible excavation changes. For genuinely buried infrastructure a city needs utility records, ground penetrating radar, or a scoped excavation survey.
What does a city receive after a lidar survey?
Usually a classified point cloud in LAS or LAZ, a bare-earth digital terrain model, a digital surface model, a normalized surface model, and contours or breaklines. Many contracts also include building footprints, a canopy height model and a metadata file stating the collection date, point density, coordinate system and stated accuracy. Derived layers are the parts most departments actually open.
How often do cities need to remap with lidar?
It depends on what is changing. A regional terrain model for flood planning may stay useful for years, while a fast-growing district or an active construction zone may need annual or more frequent updates. Cities often set a refresh cycle, commonly a few years for the full municipality with targeted high-resolution flights in between for the places that move fastest.
How can I see a lidar map for my city?
Search your city or county open data portal first, then check the USGS 3D Elevation Program and any state lidar program covering your area. Downloads are usually LAS or LAZ tiles you open in QGIS, CloudCompare or a Potree-based web viewer. Coverage is uneven, so a rural county may have nothing older than a decade while a state capital has multiple recent flights.
Does lidar work at night and in bad weather?
Yes to night, because lidar is active and needs no sunlight, which is why many surveys fly around dawn. Fog, heavy rain, dust and snow degrade returns because particles scatter the beam and absorb energy. Crews will wait out poor conditions, and any project flown during marginal weather usually shows up later as gaps in the point cloud.
Conclusion
Start by looking for data you already have. For most teams, how cities use lidar for mapping is a data discovery problem before it is ever a collection problem. Search your city’s open data portal, then the USGS 3D Elevation Program and your state’s lidar program, and check the acquisition date before assuming a project needs new collection. If a recent dataset exists, the first real question is which derived layer your team is missing, not which sensor to buy.