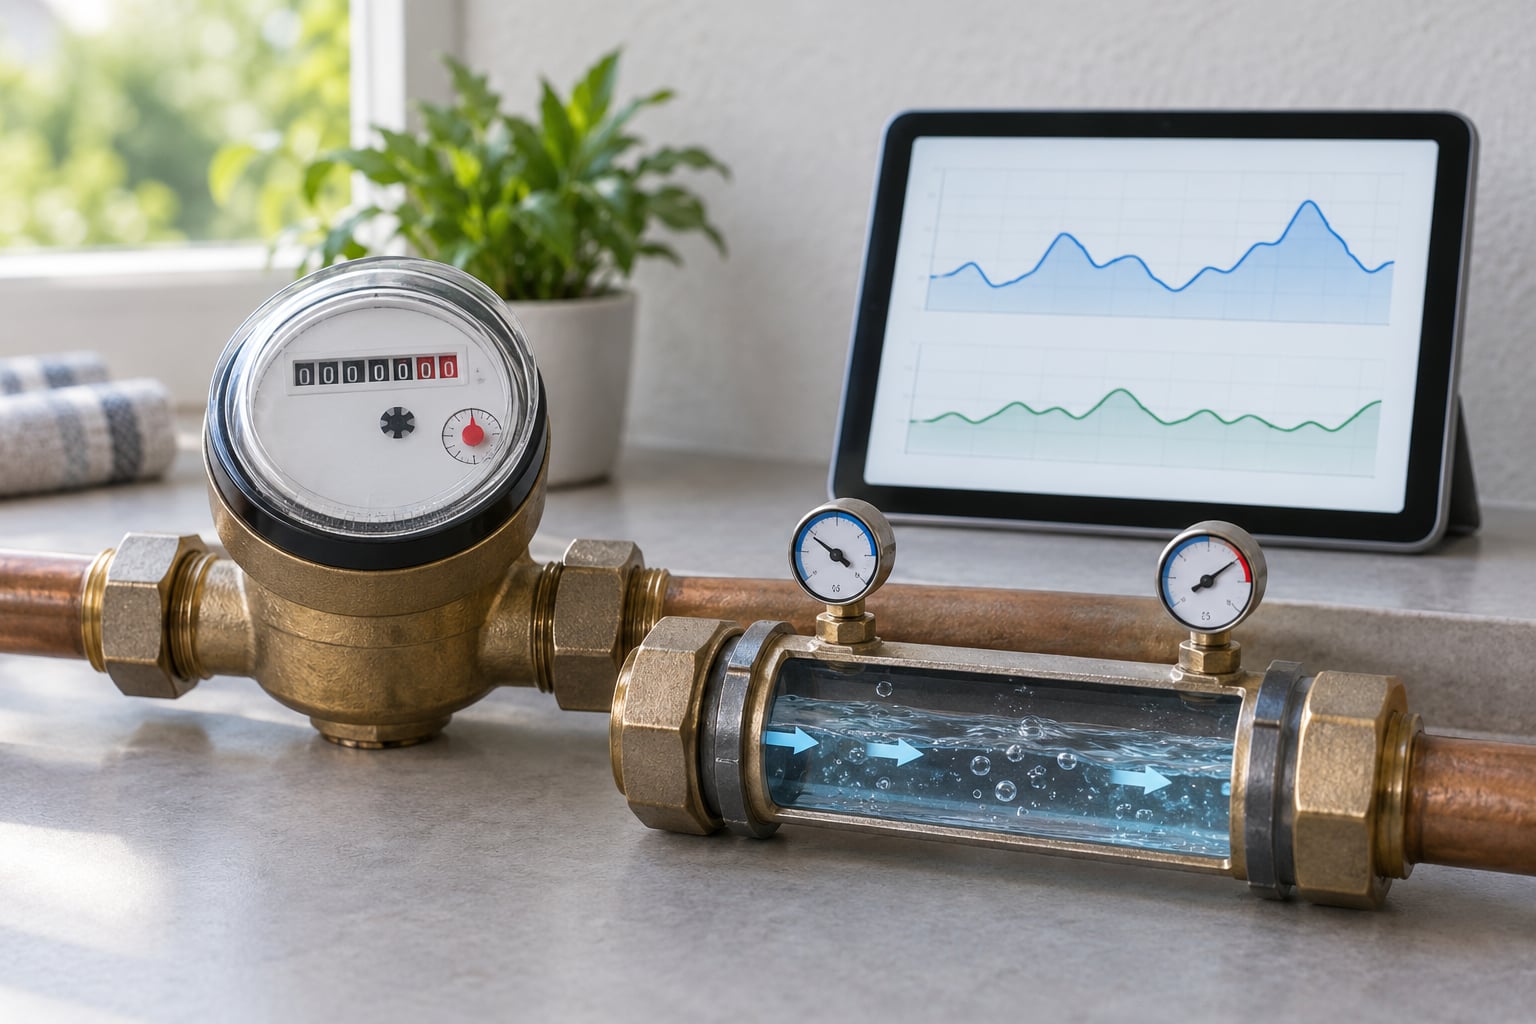
How smart water meters detect leaks is a data question, not a plumbing one. A meter logs flow at fixed intervals, and software flags two patterns: flow that never drops to zero during hours when a property should be quiet, and spikes that jump past what the household normally uses. The meter cannot see the pipe. It only sees the pattern.
That distinction matters more than it sounds. A traditional meter read once a month tells you what happened after the water bill arrived. An interval-reading meter tells you at 3 a.m. on a Tuesday that 0.5 litres an hour went past while every tap in the house was closed.
The rest of this guide covers what the hardware records, how the analytics turn readings into alerts, and where the technology stops working. Most people asking this question are either a utility engineer sizing an AMI programme, a property manager dealing with tenants, or a homeowner who got an alert and has no idea what to do next. All three need the same foundation.
Table of Contents
- How Smart Water Meters Detect Leaks
- How smart water meters detect leaks, step by step
- AMR and AMI are not the same thing
- What Data Smart Water Meters Collect
- How Flow Readings Reveal a Suspected Leak
- Continuous low flow
- Sudden spikes
- Minimum night flow
- Baseline deviation and peer comparison
- Pressure and Temperature Changes as Clues
- Common Leak Signatures Smart Meters Identify
- How Utilities Confirm a Meter Alert
- What Smart Meters Cannot Detect
- Frequently Asked Questions
- Can a smart water meter detect a very small leak?
- Why does a smart water meter show flow when no fixtures are running?
- How do utilities tell a leak apart from normal overnight water use?
- Do smart water meters shut off the water automatically when they find a leak?
- Can smart meters detect leaks inside apartment buildings and shared buildings?
- What should someone do after receiving a suspected leak alert?
- Conclusion: Use Patterns, Not Just a High Bill
How Smart Water Meters Detect Leaks
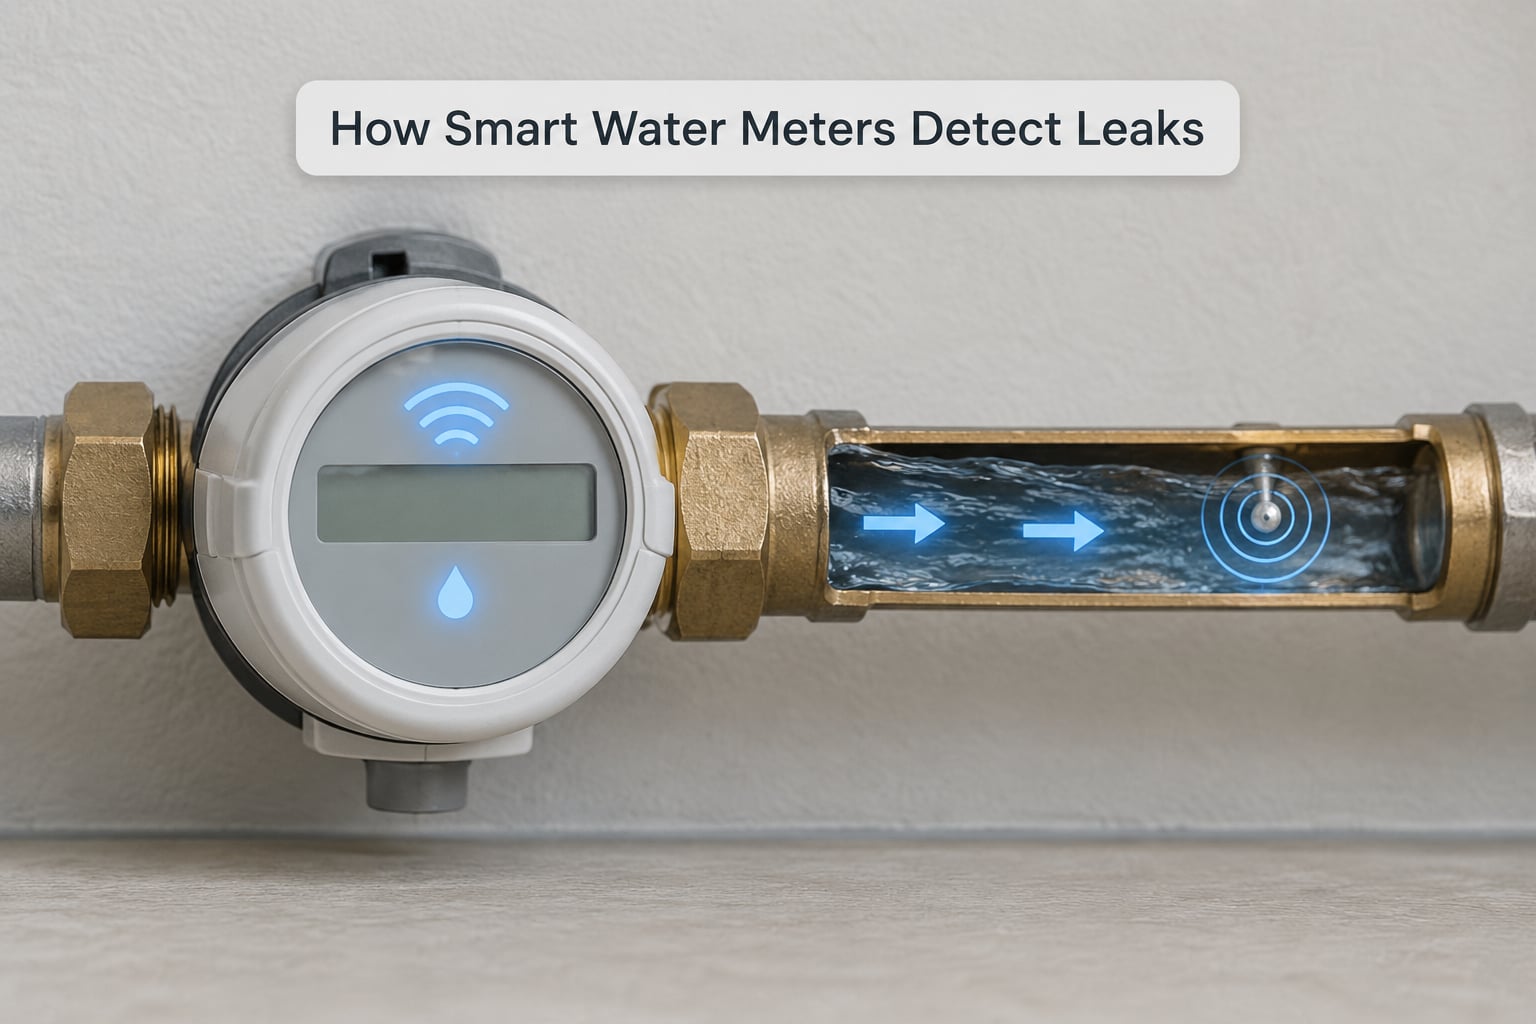
Detection runs on five steps, and every one of them has a failure mode worth knowing. Skipping ahead to step four without understanding step two is why some deployments generate nothing but false alarms.
- Measure. A sensor registers the flow passing through the meter body, usually as a pulse count or a transit-time differential.
- Log. A microcontroller totals the volume and writes it to memory at a fixed interval, typically 15, 30 or 60 minutes, alongside status flags.
- Transmit. Each interval reading goes to a meter data platform over a wired bus or a cellular or LPWAN network.
- Compare. The platform checks the reading against a threshold, the property’s own baseline, and often a peer group of similar homes.
- Flag. A matching pattern raises a leak alert, which lands in a utility work queue, a property dashboard, or a resident’s app.
How smart water meters detect leaks, step by step
The read interval is the single biggest factor in sensitivity. A meter that reports hourly can only tell you an hour has passed with water moving. A meter reporting every 15 minutes can tell you water moved in three of those four slots and then stopped, which is the shape of a dishwasher cycle rather than a leak.
City-scale programmes generally aim somewhere in that range: 15-minute intervals are dense enough to separate a fixture run from a background flow, and cheap enough that battery life still reaches ten years. Larger utilities in the Gulf and across North America have deployed networks of a million endpoints or more at that cadence.
AMR and AMI are not the same thing
Automatic meter reading (AMR) is one-way. The meter speaks when a truck drives past with a receiver, and you get a number. That is fine for billing and useless for leak detection, because a leak that started on Monday is invisible until someone reads the dial in April.
Advanced metering infrastructure (AMI) is two-way. Readings arrive on a schedule without a visit, and commands can travel back to the endpoint, which is what makes remote configuration, on-demand reads and controllable leak valves possible. Every leak-detection capability described here depends on AMI.
What Data Smart Water Meters Collect
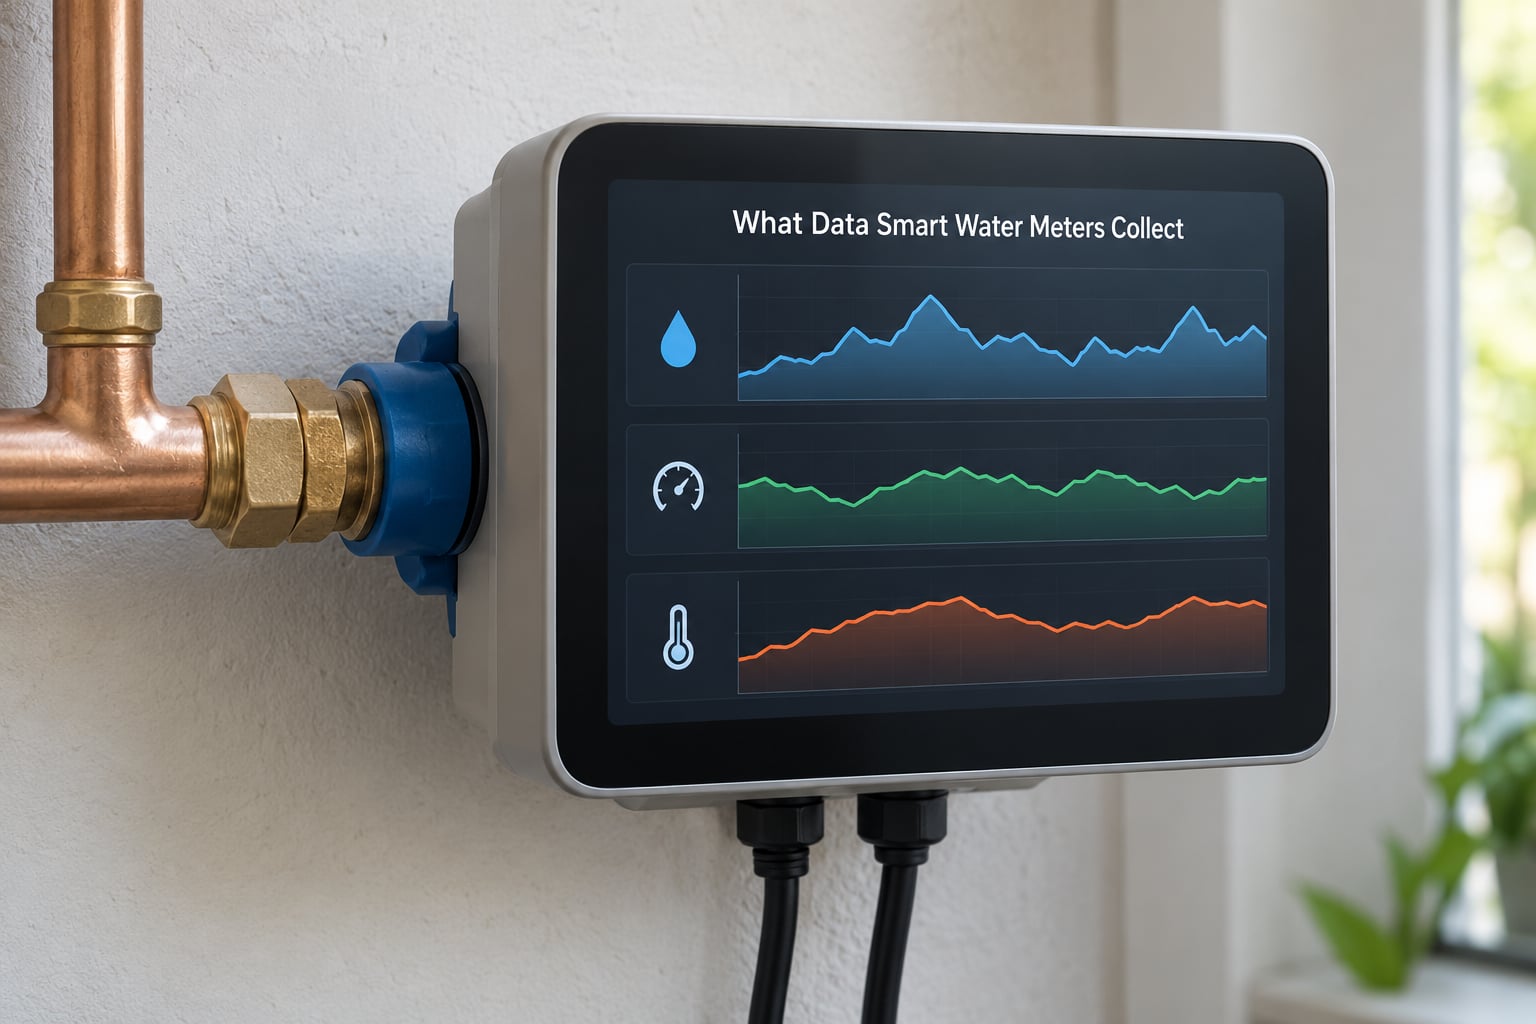
Four measurements do the work. Knowing which is which saves a lot of confusion, because people expect a meter to report pressure and temperature even though most residential endpoints do neither.
| Measurement | What it records | What it can reveal | What it cannot reveal |
|---|---|---|---|
| Total consumption | Cumulative volume, usually to a cubic metre or gallon | Billing, and whether usage rose or fell over a month | Anything about timing, so a leak and a big laundry day look identical |
| Interval consumption | Volume passed during each reporting window | When water moved, and for how long | Which fixture moved it |
| Instantaneous flow | Live flow rate, often 0.1 to 1 minute resolution | Shape of a flow event, and duration of continuous flow | The physical location of a leak |
| Pressure and temperature | Line pressure and water temperature, on utility meters and some commercial endpoints | Supporting evidence: a pressure drop or an unusual swing | Leak location on the customer side |
Underneath, four measurement technologies dominate. Mechanical pulse output counts a rotating impeller and is the old standard, cheap but increasingly poor at low flow. Photoelectric direct reading senses the interface between a fluid and light. Ultrasonic meters compare the speed of a pulse travelling with the flow against one travelling against it, which is accurate at low flow because the impeller is not there to stall. Electromagnetic meters use Faraday’s law and handle dirty water well, at higher cost and power draw.
Low-flow accuracy is the spec that matters most for leak work. A meter that stops registering below a certain rate will report a slow drip as exactly zero, and no amount of analytics downstream will recover a signal the sensor never captured.
How Flow Readings Reveal a Suspected Leak
Three patterns carry almost all of the signal, and they are worth separating clearly because each points somewhere different.
Continuous low flow
This is the signature of a running toilet, a dripping tap, or a toilet flapper that never seats. Water never reaches zero, so the meter keeps logging small positive intervals through the quietest hours of the night. The threshold sits low, often a few litres an hour, because that is the range where a leak stops being cosmetic and starts costing money.
Sudden spikes
A burst pipe or a fixture left running produces a sharp step change in interval consumption that sits far outside the property’s normal band. Spikes are the easiest pattern to detect and the most urgent, which is why most platforms put them at the top of the alert queue.
Minimum night flow
Minimum night flow, usually shortened to MNF, is the industry-standard technique and it deserves an explanation rather than a name. The idea: in the small hours, when occupancy is at its lowest, the only water moving through a healthy property should be background leakage, the slow seepage of every worn washer and gasket. Measure that floor, average it over several nights, and any persistent rise in the floor means new water is entering the system somewhere.
Worked example. A property’s night floor sits at 0.8 litres per hour for most of the month. Over one week in July it climbs to 2.1 litres per hour and holds there. The pattern is not a toilet running occasionally, because the floor is now constant. It is a new background source, and a property manager would send someone to look at the riser feed and the exterior hose bibs.
Utilities run the same calculation at district scale on a district metered area, a zone fed by one large meter. MNF for a zone of a few thousand homes works out to a few hundred litres per hour, and when that number climbs at night, the water is going into the pipes rather than into the houses. The customer’s meter then narrows down which street, and eventually which service.
Baseline deviation and peer comparison
Individual thresholds catch obvious problems. More sophisticated platforms build a profile of what a property normally does and flag deviations from it, often expressed as a percentage deviation sustained over several intervals. Comparative benchmarking adds a third reference: consumption normalised for property size, occupants and season against similar nearby homes.
That last method catches what thresholds miss. A property using three times its peer group is not a leak, but it is a lead.
Pressure and Temperature Changes as Clues
Pressure and temperature are supporting evidence, not the primary signal, and it is worth saying why. Most residential AMI endpoints measure volume and temperature of the water passing through. Line pressure is usually monitored at district meters and zone points, not at every house, because the sensors and the maintenance burden are expensive.
Where pressure data does exist, it strengthens a case in specific ways. A pressure drop that coincides with a period of high flow suggests demand exceeding what the line can supply, which fits a leak large enough to be visible. Unusual pressure variability, a line that swings rather than holding steady, points at a leaking service or a failed pressure-reducing valve. Neither pattern proves anything alone.
Temperature helps in narrower cases. A continuous low flow that never matches the ambient temperature of the surrounding soil can indicate water moving from a hot line. Irrigation controllers and pressure-regulating devices also move both readings, so both can swing without a leak being present anywhere.
Common Leak Signatures Smart Meters Identify
The five signatures below cover the overwhelming majority of alerts a well-tuned system produces. Knowing which one you are looking at tells you where to look first.
| Signature | What the data looks like | Typical trigger | Likely cause | Urgency |
|---|---|---|---|---|
| Constant overnight flow | Non-zero interval flow from roughly midnight to 5 a.m., every night | Sustained flow above a low threshold for several consecutive night windows | Running toilet, dripping tap, irrigation valve stuck open | Medium, but silent and continuous |
| Repeated small events | Short bursts at similar times each day | Identical short pattern recurring daily | Humidifier, ice-maker line, pressure-reducing valve weeping | Low to medium |
| Fixture-time spikes | Sharp rise during morning and evening peaks | Consumption far above the property’s own baseline | A fixture left running, a guest, a changed routine | Medium, often a false positive |
| Pressure loss under peak demand | Line pressure falls as flow rises | Pressure below normal while consumption is high | Service leak or undersized line under load | High |
| Seasonal or irrigation shifts | Daytime consumption rises and falls with the calendar | Profile change that matches weather or a watering schedule | Legitimate outdoor use, or a sprinkler head broken and running | Varies |
The last row is where alert fatigue comes from. A watering schedule that starts before dawn produces a night-flow signature every single night, and a system with no seasonal awareness will flag it daily until the household stops reading alerts. Real deployments handle this with watering schedules entered into the platform, and with baselines that shift by season.
Consumers see the same effect through whole-home monitors, which is where a lot of the confusion online comes from. The typical alert reads something like “water has been running for two hours, averaging 0.06 gallons per minute,” on a property with no visible leak. Duration plus average flow rate is exactly the pair of numbers that tells you whether to worry, and 0.06 gallons per minute is a slow drip-scale loss, roughly 3.6 gallons an hour.
How Utilities Confirm a Meter Alert
A flag is a hypothesis, not a diagnosis. The confirmation workflow is where the actual water gets saved, and it tends to follow the same sequence.
- Review the history. Pull 30 to 90 days of interval data and look at when the change started, whether it is continuous or event-shaped, and whether it correlates with weather or a billing period.
- Benchmark against neighbours. Compare normalised consumption with similar properties on the same street. One house standing out points to a service-side problem; a whole street trending up points to a main or zone issue.
- Contact the customer. Most alerts are closed by a phone call. The resident checks the toilets, the irrigation controller and the hose bibs, and confirms in the app.
- Field inspection. If nothing obvious turns up, a crew checks the meter pit, the valve box, the service line and the meter itself for damage or displacement.
- Test the meter. A meter pulled for service or recalibration gets a bench test for accuracy at low flow. This is where meter-caused alerts end up.
- Prioritise the repair. Continuous low flow gets a scheduled appointment. An active burst with property damage gets same-day dispatch, and larger commercial or multi-unit properties often get a remote valve closure first.
None of this needs the leak to be visible. A crew working from a confirmed flow signature can usually isolate a service line by shutting valves in sequence and watching which way the flow moves, which is far faster than hunting visually through a wall or under a slab.
What Smart Meters Cannot Detect
This is the part manufacturer pages tend to leave out, and it is the part that decides whether you trust the alert. A meter flags consumption. It does not diagnose, locate or confirm anything.
- Leaks it cannot resolve. Any loss below the meter’s low-flow accuracy reads as zero. Slow drips can sit under the noise floor indefinitely.
- Leaks upstream of the meter. Water lost in the service line between the main and the meter still passes through the meter, but water lost in the shared portion of the line or in a neighbouring property’s riser does not. Multi-unit buildings need submeters on every unit for this reason.
- It cannot locate a leak. You learn that water is moving when it should not. Finding where is acoustic testing, dye, thermal imaging or a valve search.
- Nothing during a communications outage. Battery depletion, a damaged radio, poor cellular coverage in a deep vault or a flooded pit all stop the data. A quiet meter is not the same as a dry property.
- Nothing during a power event. Most endpoints are battery powered, and they keep reading locally while offline, but the alert cannot be raised until data is transmitted again.
- It cannot separate a leak from normal life. Irrigation, pool fills, humidifiers, a new tenant, guests and a change in weather all produce the same shape of data.
- It does not confirm the cause. A leak indicator flag can be set by backflow through a check valve or by a fault in the register itself. The symbol is lit, no fixture is running, and the meter is telling the truth about water moving without there being a leak.
- Nothing without a baseline. A new install with no history and no peer comparison has nothing to deviate from. The first weeks of data are for teaching the system.
There is a privacy side too. Interval data reveals when a home is occupied, when it is empty, and how the household behaves. Utilities and consumer monitors handle that differently, and anyone deploying this at scale should decide up front what resolution is genuinely needed. Publishing every minute of every household is more data than leak detection requires.
Frequently Asked Questions
Can a smart water meter detect a very small leak?
Only above the meter’s low-flow accuracy. Most modern endpoints register down to a few litres an hour, which catches a running toilet or a dripping tap, but a slow weep below that threshold reads as zero and generates nothing. Ultrasonic meters are noticeably better at low flow than mechanical pulse meters because there is no impeller to stall. If a drip falls below your meter’s resolution, you need a fixture-level sensor rather than a better algorithm.
Why does a smart water meter show flow when no fixtures are running?
Something is still moving water. The usual culprits are a toilet flapper that never seats, a dripping tap, a stuck irrigation valve, a pool or pond filling on a timer, a humidifier, a pressure-reducing valve weeping, or another unit in a multi-unit building. Continuous flow above a low threshold for several consecutive night windows is exactly what a leak alert is designed to catch, so treat it as a real signal and start checking fixtures rather than ignoring it.
How do utilities tell a leak apart from normal overnight water use?
They use minimum night flow, the industry-standard method. In the small hours the only water that should move through a healthy property is background leakage from worn washers and seals. The utility averages that floor over several nights and flags a sustained rise in it, which rules out the occasional dishwasher run and points at a constant new source. Rainfall, seasonal watering schedules and irrigation controllers are entered into the model so legitimate night use does not trigger a flag.
Do smart water meters shut off the water automatically when they find a leak?
Not by themselves. A meter detects and reports; it does not control a valve. Automatic shutoff comes from a controllable valve paired with the meter, usually on commercial and multi-unit properties where a single command can close a whole riser. Home systems pair a whole-home monitor with a smart shutoff valve instead. For most single-family homes, an alert that reaches a resident’s phone is the end of the automated chain, and the rest is manual.
Can smart meters detect leaks inside apartment buildings and shared buildings?
Partly. Water lost inside an individual unit passes through that unit’s meter, so unit-level alerts work. Water lost in a shared riser, a boiler feed or a building main passes through the building’s master meter only, so every tenant looks normal. That is why multi-unit buildings need a master meter for the building plus a submeter on every unit, and why vacancy detection matters: any flow at a unit with no occupancy is a clear signal. Interior leaks behind walls still need acoustic or moisture sensors.
What should someone do after receiving a suspected leak alert?
Start by confirming water is actually moving: check the app’s live flow rate, then close every fixture and watch whether the reading drops to zero. If it does not, trace outdoor hose bibs, the irrigation controller and any pool or pond fill line. If it does drop, the alert was probably a legitimate use event. Read the duration and average flow rate on the alert, since a two-hour average of a fraction of a gallon per minute is a drip and a sudden high-rate spike is a burst worth calling about immediately.
Conclusion: Use Patterns, Not Just a High Bill
The takeaway on how smart water meters detect leaks is simple: they read patterns, not pipes. An interval reading that never returns to zero at 2 a.m., a step change far above a property’s own baseline, or a night-flow floor that has crept upward all point the same direction. None of them tell you where to drill.
If you are checking your own property, establish the baseline first by watching a few weeks of interval data before assuming anything is wrong. Then look for persistent unexplained flow rather than a single spike, confirm it by closing fixtures and watching the rate drop, and verify with a pressure reading, an acoustic sweep or dye before anyone opens a wall.
Then call the utility or a qualified plumber. The meter’s job was to tell you something is wrong. Finding it and fixing it is still somebody else’s job, and doing it in a scheduled appointment costs far less than it does at 2 a.m.