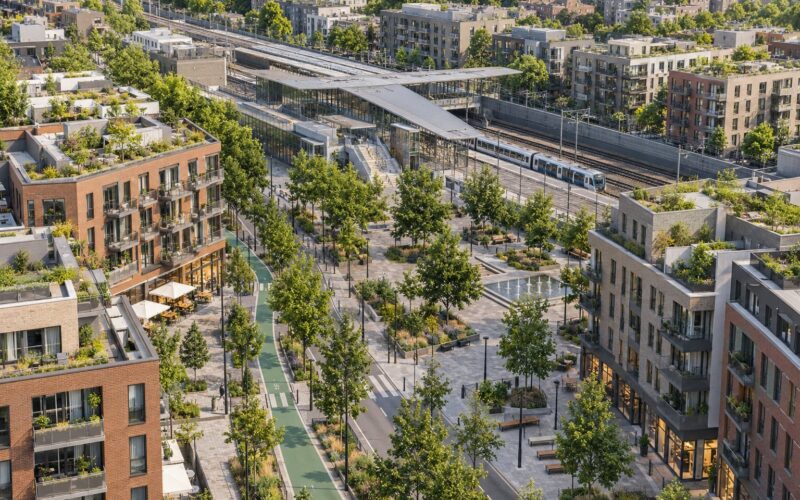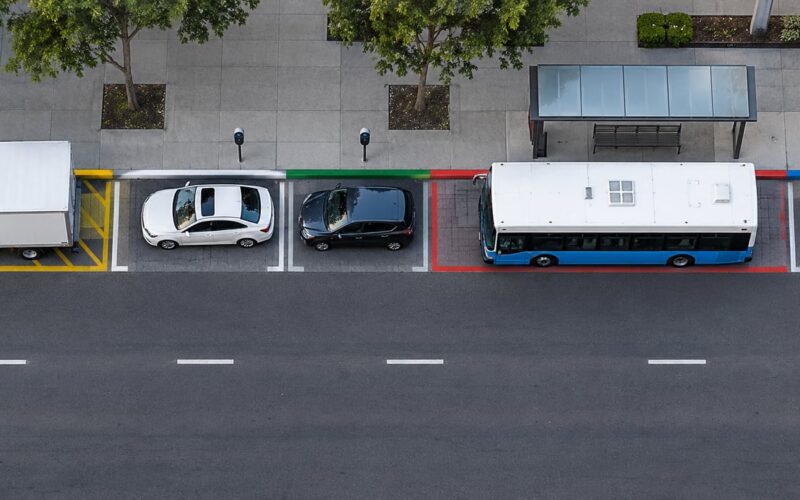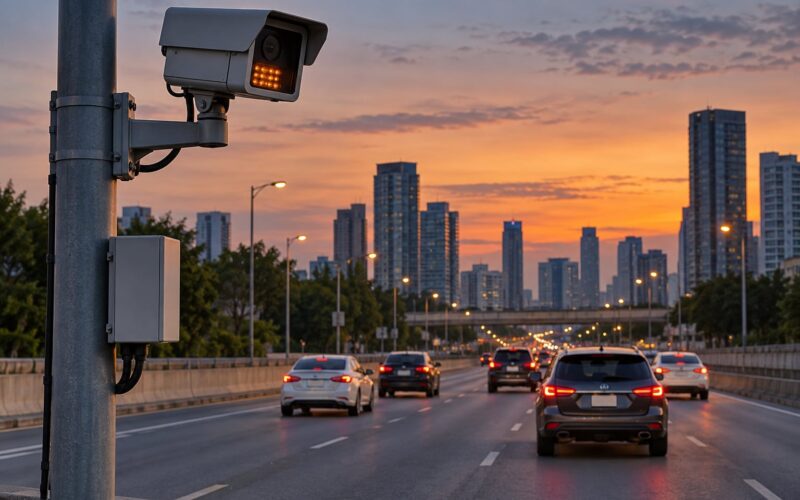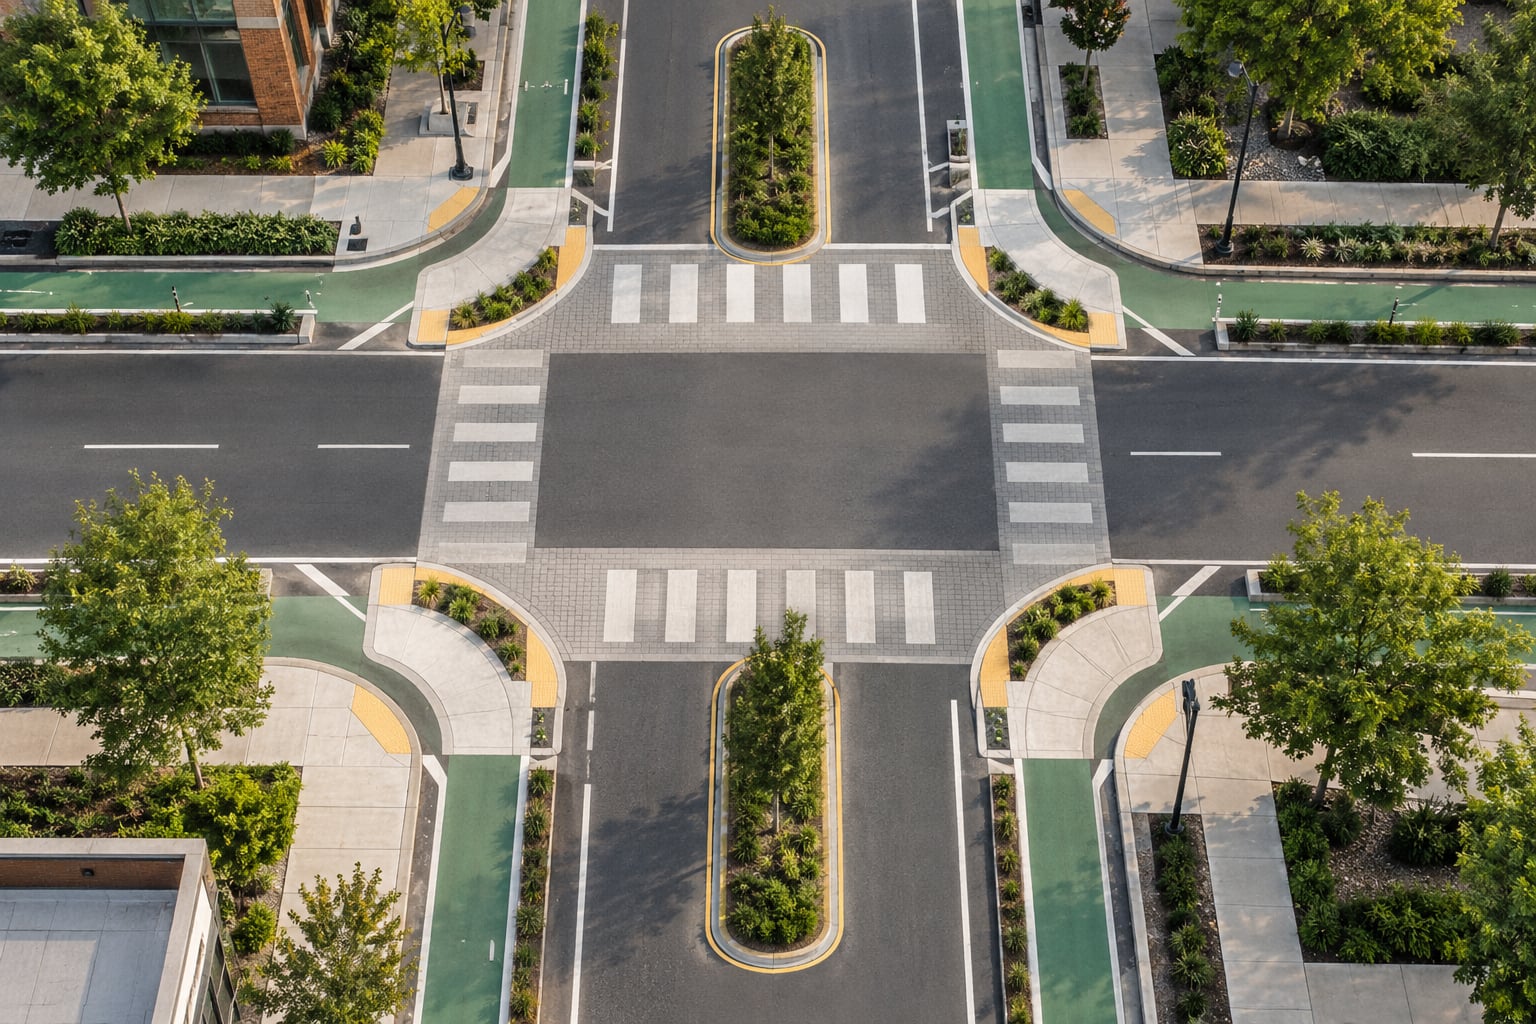
A Vision Zero program works by moving responsibility for road safety away from road users and onto the people who design, build, fund and govern the streets. Cities map where serious crashes concentrate, cut vehicle speeds through redesign, treat the worst corridors first, and back it with enforcement, education and faster emergency response.
It is not a slogan about slowing traffic down for its own sake. A city that adopts Vision Zero commits to a stated target, a budget and a public list of projects, and it gets judged on whether deaths and serious injuries actually fall. That distinction matters, because adoption is cheap and construction is not.
I have pulled together how the program is structured, what cities actually build, who does the work, and where the evidence is genuinely contested. If you are on a city team, writing a safety plan, or just trying to work out whether the program in your town is real, this should give you a usable answer.
Table of Contents
- What Is Vision Zero and Why Does It Matter?
- How Does the Vision Zero Approach Reduce Traffic Deaths?
- What Are the Main Pillars of a Vision Zero Program?
- How Do Cities Choose Which Streets to Fix First?
- How Does Safe Street Design Support Vision Zero?
- How Does Speed Management Fit Into Vision Zero?
- Who Leads a Vision Zero Program?
- How Do Cities Fund and Implement Vision Zero Actions?
- How Do Cities Measure Whether Vision Zero Is Working?
- What Makes Vision Zero Programs Inclusive and Equitable?
- What Challenges Do Vision Zero Programs Face?
- How Can Cities Start a Vision Zero Program?
- Frequently Asked Questions
- How does Vision Zero work?
- What does Vision Zero aim to achieve?
- What are the key strategies of Vision Zero?
- How is Vision Zero different from Complete Streets, road diets and traffic calming?
- Has Vision Zero been successful?
- What is the most common reason a Vision Zero program stalls?
- Conclusion
What Is Vision Zero and Why Does It Matter?
Vision Zero is a road safety strategy that sets a goal of zero traffic deaths and serious injuries, and it assigns shared responsibility for reaching that goal to everyone who influences the road system, not only to the people driving on it.
The idea came from Sweden, where parliament adopted the policy known as Nollvisionen in October 1997. The Swedish National Road Administration treated it as a design brief: roads should be built so that a human being making an ordinary mistake does not die. Policy layers followed later, including the Safe System approach the World Health Organization and the United Nations promote, and the international Vision Zero Network that now coordinates policy sharing among cities and agencies.
Why it matters comes down to a hard fact. Most serious crashes are not caused by villains. They happen because a driver is distracted for two seconds, a pedestrian steps off a kerb into a gap in traffic, or a car travels thirty miles an hour through a space built for ten. Design that tolerates ordinary human error prevents far more harm than campaigns asking people to stop making it.
It also reframes who dies. The people most likely to be killed on a road are the ones moving fastest through it while also being the least protected, which in most North American cities means people walking, cycling, riding motorcycles, and older or disabled people on foot. Treat road death as a public health problem rather than a discipline problem and the tool kit changes completely.
How Does the Vision Zero Approach Reduce Traffic Deaths?
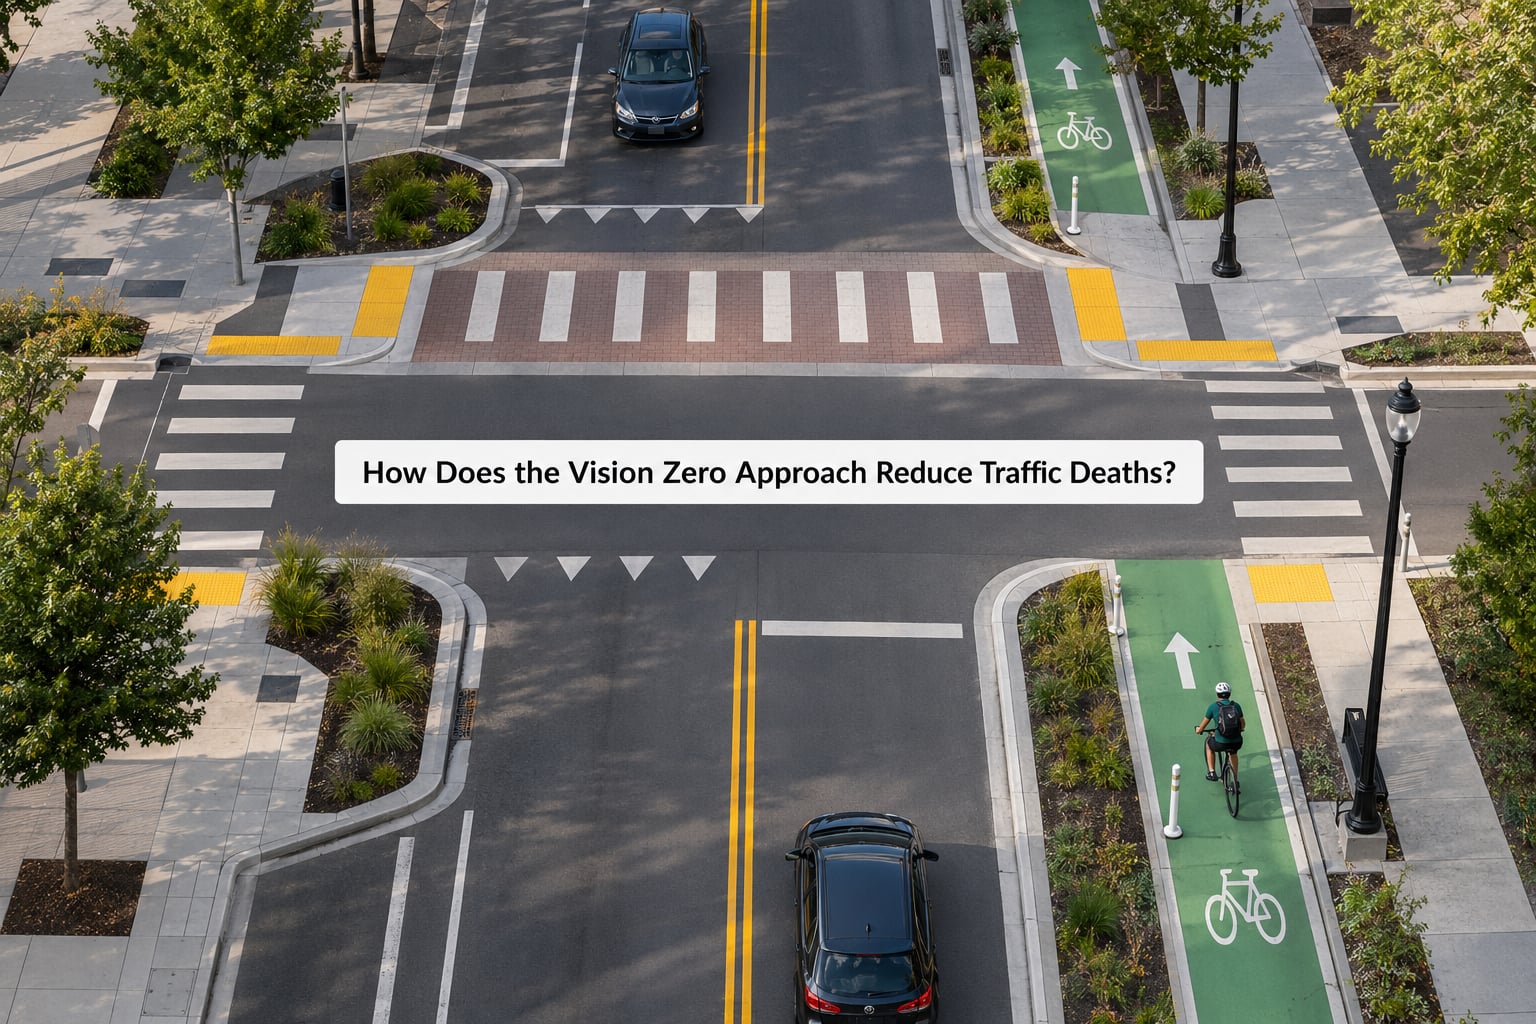
How Vision Zero reduces deaths is straightforward once you accept one idea: crashes cannot be eliminated, but crashes can be made survivable. The program identifies where severe crashes are most likely, reshapes those places so the energy involved in a collision stays low, and adds layers of protection so one failure does not become a fatality.
Speed sits at the centre of the logic because energy rises with the square of velocity. Research published by the US National Highway Traffic Safety Administration and the Federal Highway Administration has repeatedly estimated that a pedestrian struck at about 20 miles an hour survives roughly nine times out of ten, while the same person struck at 40 has a survival chance closer to one in four.
| Vehicle impact speed | Approximate risk of a pedestrian death in a crash with a passenger car |
|---|---|
| 20 mph (about 32 km/h) | Roughly 10 to 15 percent |
| 30 mph (about 48 km/h) | Roughly 35 to 45 percent |
| 40 mph (about 64 km/h) | Roughly 70 to 75 percent |
| 45 mph (about 72 km/h) | Roughly 80 percent |
Those are population-level estimates, not a promise about any individual crash, and they vary with vehicle type, impact angle and whether the person is braced. What they show is the shape of the curve: small speed reductions produce large drops in death risk, which is why a city changing a street from 30 to 20 miles an hour is making a life-safety decision, not a political one.
Speed reduction alone is not enough, because the same driver who is speeding may also be impaired, or driving a large vehicle, or crossing the centre line. That is why good programs layer four kinds of intervention. Engineering changes the street itself, enforcement changes behaviour that engineering cannot reach, education prepares road users and drivers, and emergency response shortens the time between a crash and medical care. Each layer catches the failures the others miss.
What Are the Main Pillars of a Vision Zero Program?
The Safe System framework, which is the shared parent of Vision Zero policies, groups its work into five pillars that a mature program treats as one system rather than five separate projects.
- Safe speeds. Setting and enforcing speed limits that reflect what the street can physically survive, and matching design speed to posted limit so the geometry of the road supports compliance instead of contradicting it.
- Safe roads. Designing roads so that ordinary human error does not produce death, through separation of movements, forgiving intersections, clear markings, lighting and forgiving edges.
- Safe vehicles. Pushing for safer vehicle standards, including intelligent speed assistance, automatic braking for pedestrians and cyclists, and better direct vision from the cab.
- Safe road users. Public education, licensing standards, enforcement against impaired and aggressive driving, and designing routes people can actually understand.
- Post-crash care. Faster emergency response, better crash location data, and first-responder systems that reduce the time a seriously injured person spends without care.
Two more pillars have been added by cities working in communities with high levels of traffic violence, and they matter for how a program is judged as much as for what it builds. Equity means checking who is dying and where, then directing money at the highest-risk places rather than the most photogenic ones. Community leadership means residents on the corridors being rebuilt have a real vote on the design, not a comment period after the drawings are finished.
How Do Cities Choose Which Streets to Fix First?
Cities prioritise using a combined view of crash history and exposure, usually mapped as a high injury network: the small share of streets that carry a large share of fatal and serious injury collisions. In Milwaukee, for example, roughly 53 percent of traffic deaths occurred on about 10 percent of the arterial street network, which is the kind of concentration that makes targeting obvious rather than ideological.
The analysis usually layers four things on top of each other.
- Crash records. A multi-year view of fatal and serious injury collisions, often reported as a KSI, killed or seriously injured, count, because small annual swings otherwise hide real trends.
- Exposure. Pedestrian and cycling volume, so a road with ten crashes a year and heavy foot traffic is ranked differently from a quiet road with the same count.
- Speed data. Spot speed measurements, travel time data and proportion of drivers exceeding the limit, since speeding is both a strong crash predictor and evidence that a posted limit is not being believed.
- Conflict and near-miss data. Video and observational counts of conflicts, which show risk where crashes have not yet accumulated and give a before-measure for streets with no crash history at all.
Community reports get layered onto the analysis too, and the quality of that layer varies more than cities admit. A bus driver logging near-misses every shift produces a very different map from a public comment box, which tends to attract people with a strong opinion and a free afternoon. Cities that publish their scoring method and let residents challenge individual segments tend to end up with better-informed plans and fewer credibility fights later.
How Does Safe Street Design Support Vision Zero?
Safe street design supports Vision Zero by making the safe behaviour the easiest behaviour, and by lowering the speed at which any failure turns fatal. It is the part of the program that survives contact with politics, because a concrete island at an intersection is difficult to argue with once it exists.
The recurring treatments are curb extensions that shorten crossings and slow turning vehicles, raised crosswalks and speed tables that make the limit physically self-enforcing, median refuge islands that cut an exposed crossing into two manageable stages, and protected cycle tracks that remove the door-zone fear that keeps people off bikes. Road diets and lane reductions fit the same logic: they remove the capacity that encourages speed while returning space to people walking, cycling and waiting for transit.
| Intervention | Relative cost | Typical install time | Evidence strength | Common objection |
|---|---|---|---|---|
| Paint, signs and refreshed markings | Low | Days to weeks | Modest on its own, fades without maintenance | Seen as cosmetic and temporary |
| Quick-build curb extensions and flex-post islands | Low to moderate | Weeks to a few months | Good for speed and yielding behaviour | Believed to be a stopgap |
| Speed limit reduction to 20 or 25 mph with design support | Low | Weeks | Strong where design supports the number | Fear of congestion and emergency response times |
| Raised crosswalk or speed table | Moderate | Months | Strong on approach speeds, needs drainage and snow planning | Concerns over emergency vehicle and bus access |
| Protected bike lane network | Moderate to high | Months | Strong, and improves conditions for every other user | Loss of parking and retail access |
| Full road diet with rebuild | High | One to three years | Strong where volumes allow the reallocation | Traffic diversion to parallel residential streets |
| Automated speed enforcement | Low to moderate, plus staff time | Months, dependent on legislation | Strong where it is legally permitted | Blocked in some states, politically contested |
Lighting deserves its own line, because it is cheap, uncontroversial and effective. Street lighting shows a pedestrian at the edge of a headlight beam, which is exactly the moment a driver would otherwise miss them. Cities that add lighting on high injury corridors tend to see it treated as the easy first win, and the objections are correspondingly mild.
How Does Speed Management Fit Into Vision Zero?
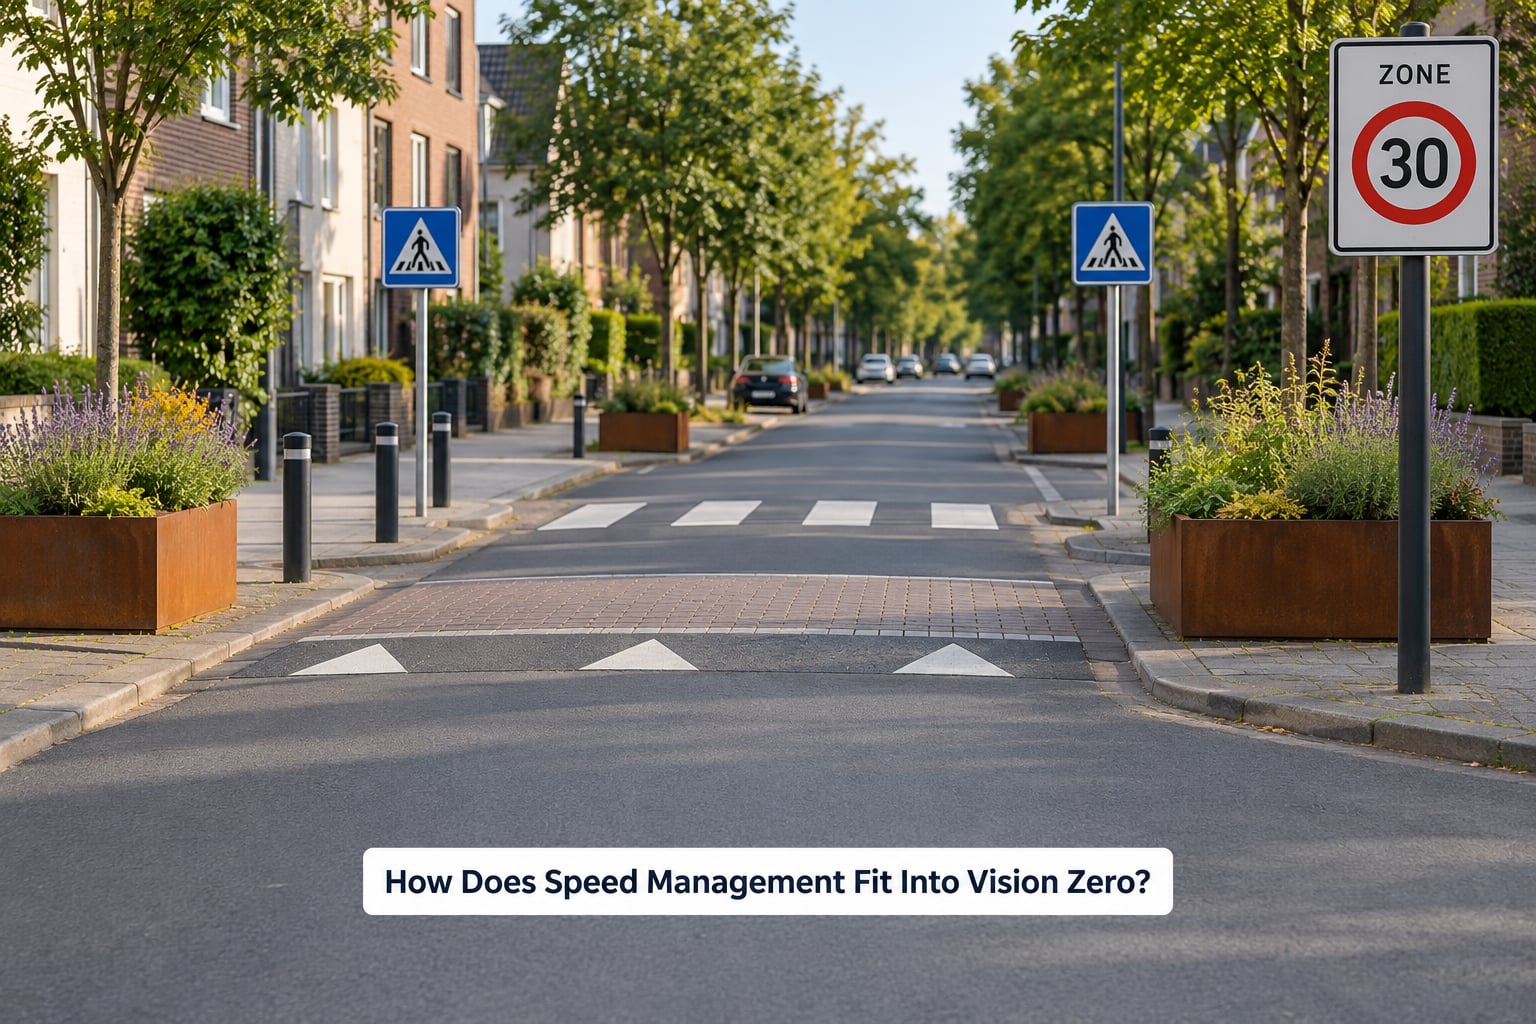
Speed management is the core lever, and the term covers more than the sign. A posted limit is a message; design speed is what the road actually communicates through lane width, curvature, sight distance and surface. When those two disagree, drivers follow the road, and the city has lost the argument before it started.
A workable program closes the gap in three ways. It sets lower limits in places with people in them, especially around schools, transit stops and commercial frontage. It rebuilds the street so the limit feels right at that speed, using entry treatments, raised crossings, narrower lanes and planted separation. And it enforces the limit, with police operations on the corridors that appear on the high injury map rather than general patrol.
That last part has turned into the sharpest political fight in the field. Residents in cities from Vancouver to Edmonton have pushed back on photo radar and traffic camera programmes, in Edmonton after most photo radar was scrapped in urban areas, and in Vancouver after council passed a weakened traffic camera measure. Some US states also preempt local authority over automated enforcement, and Wisconsin law restricts municipal traffic safety cameras, which is a constraint Milwaukee planners have had to design around rather than campaign against.
The counterargument to enforcement deserves an honest hearing. Critics argue that the money is better spent on lighting, on impaired-driving enforcement, on design, or on telling people how to behave, and that a camera programme treats a symptom while a street rebuild treats the disease. Both can be true at once, which is why cities that combine design with targeted enforcement tend to hold their public support better than cities that do one or the other alone.
Who Leads a Vision Zero Program?
Nobody single agency leads a Vision Zero program, and the programs that stall are usually the ones where somebody tried to hand it to a single department. The work spreads across at least seven groups, and each one can quietly stop a project if it is not in the room from the start.
- City council adopts the policy, approves speed limits, and votes on the budget that funds construction.
- Transportation and public works owns the road design, maintenance and capital programming that make the changes physical.
- Police handle enforcement priorities, crash reporting and the traffic stop data that the whole analysis depends on.
- Public health brings injury surveillance, hospital data and an equity lens, and it is often the loudest internal advocate for the program.
- Emergency services test whether a redesigned street will slow an ambulance, which is the first objection raised in public meetings.
- State or regional agencies control many of the highest-crash corridors, since arterials and state routes are frequently not city streets at all.
- Residents, schools and advocacy groups supply the local knowledge that identifies unreported risks and the pressure that keeps projects moving.
The jurisdictional split is the part outsiders miss. A city can adopt a fearless Vision Zero policy and still have no authority over the road where most of its people are dying, because that road belongs to a state department of transportation or a regional authority. Checking who owns the worst street before writing the plan saves a lot of wasted effort.
How Do Cities Fund and Implement Vision Zero Actions?
Vision Zero works fastest where a city can pay for small changes quickly and treat big rebuilds as a separate track. A capital program that takes three years to get through design review will lose the corridor a decade in the meantime, and residents will have stopped believing anything will happen.
Funding usually comes from a mix, and the mix matters more than the headline totals. Capital budgets handle full rebuilds and new signals. Operating budgets cover enforcement overtime, education campaigns, speed data collection and the maintenance that keeps quick-build treatments from wearing out. Regional and state surface transportation programs fund arterial work. Bond measures and development impact fees spread cost over time or tie it to growth. Federal and state safety grants are competitive and slow, and they rarely fund the fast early work that builds momentum.
Staffing is the budget line nobody plans for. A city that adopts a policy without adding a traffic safety engineer, a data analyst, or a communications lead will spend its budget on external consultants instead, and the institutional knowledge never stays. Cities that get further tend to have someone whose actual job is this programme, plus a budget line that survives a change in leadership.
Two implementation details separate programs that move from programs that stall. First, maintenance funding gets identified at the same time as construction. Flex-posts need replacing, paint needs repainting, and a street whose markings fade in two years teaches drivers the opposite lesson. Second, quick-build projects get a defined end date, and cities publish a scorecard for each one so the temporary work visibly becomes permanent work.
How Do Cities Measure Whether Vision Zero Is Working?
A Vision Zero program is measured on two clocks at once, and cities that only report one of them either look like failures or look like frauds. Lagging indicators are the outcomes: deaths, serious injuries, and the trend in KSI collisions over five years. They move slowly and are noisy, which is exactly why they should be published for the whole city and for each treated corridor separately.
Leading indicators are the things that should change first: measured speeds, the share of drivers above the limit, conflict counts at treated intersections, crossing delay for pedestrians, walking and cycling counts, seatbelt and impaired-driving enforcement levels, and the share of the high injury network already treated.
Milwaukee offers a useful example of what corridor-level reporting looks like. According to figures reported in 2026 by a local news outlet covering the programme, the city recorded a 19 percent drop in traffic deaths compared with 2024 and more than 26 percent below its 2022 peak, and on Lapham Boulevard the change from 30 to 25 miles an hour was followed by a 70 percent drop in drivers travelling above the speed limit. The city launched its programme in 2022 with a target of zero deaths by 2037, and its fire department reported transporting far more living patients than before, which is a post-crash care result rather than a street design one.
What that example does not prove is worth saying plainly. A three-year change on one corridor, in a city with a declining trend, cannot be attributed to one intervention. Good programmes report the comparison against a citywide or peer-city trend, not just against their own previous year, because fatality counts move for reasons that have nothing to do with road design.
Because attribution is genuinely hard, cities and researchers lean on before-and-after studies of individual treatments, which is why corridor reporting matters more than citywide averages. The pattern that shows up most often is that speed reduction and physical calming produce the fastest, most consistent changes, and that the improvements tend to be larger in the years after installation than in the first year, when drivers are still adjusting.
| City | Programme start | Reported trend | Key interventions | Caveat worth noting |
|---|---|---|---|---|
| Milwaukee | 2022, target of zero deaths by 2037 | Deaths down 19 percent against 2024 and more than 26 percent below the 2022 peak; 70 percent fewer speeders on Lapham Boulevard after 30 to 25 mph | Lane reductions, curb extensions, raised crosswalks, signal and speed changes on the high injury arterial network | Wisconsin law restricts municipal traffic safety cameras, so automated enforcement is not available |
| Chicago and Los Angeles | Early 2010s adoption | Per-capita driving reported as rising after adoption, more than 5 percent in Chicago and more than 2 percent in Los Angeles | Policy adoption, speed management, street redesign | Figures come from a 2019 critical analysis using 2012 to 2019 data, which is dated on both ends |
| Charlotte | Adopted as a policy | No consistent citywide decline reported by residents debating the programme | Enforcement, education, planned corridor work | Local discussion argues key components were never fully implemented |
Read that table as a description of maturity rather than a scoreboard. Milwaukee has built a visible programme with funded projects on named corridors. Charlotte has adopted a policy that residents describe as largely unimplemented. Chicago and Los Angeles adopted early, before the design standards and funding structures that make the later programmes work. The pattern is consistent across the field: adoption is the start of the work, and how much physical change follows is what separates results from announcements.
What Makes Vision Zero Programs Inclusive and Equitable?
An equitable Vision Zero program treats road death as the public health and justice issue that the data shows it is. The distribution of risk is not even, and it usually tracks the distribution of poverty, speed and police enforcement pressure in a city rather than anything about the people involved.
Four practices separate programmes that mean it from those that use the word. They publish demographic breakdowns of who is dying, which usually means the analysis is genuinely uncomfortable. They apply the high injury network method consistently, so investment follows demonstrated risk instead of following which neighbourhood has organised meetings. They fund the small everyday fixes in the neighbourhoods with the worst outcomes, where residents often report feeling over-policed and under-invested at the same time. And they check displacement, because a successful safety project in a neighbourhood where rents are rising can export the people it was meant to protect.
Participation is where good intentions usually thin out. A comment period produces a document, not a decision, and residents learn quickly to tell the difference. The stronger model puts the people who live and walk on a corridor on the design team, offers the meeting in more than one language and outside business hours, pays participants where possible, and publishes what was rejected as well as what was adopted.
What Challenges Do Vision Zero Programs Face?
The most common failure mode is a gap between adoption and construction. The council passes a resolution, the city announces a target, and then the projects stall in design review or lose their funding line. Residents in Charlotte argue the city’s programme has not fully implemented its key components, and a thread in r/boulder describes the programme as a waste while noting the city still paid program costs after pandemic-era layoffs. That pattern is widespread enough to be predictable, and it is a budgeting and staffing problem more than a vision problem.
Budget pressure is the other recurring one. Road safety competes with potholes, and when a budget tightens, the visible failures get the money. Residents in Portland, Maine, describe Vision Zero as mostly minor infrastructure changes for pedestrian and cycling improvements, which is a fair characterisation of what many programmes actually are, and a reminder that a modest scope is not automatically a failed scope.
Beyond funding, the obstacles are legal, political and analytical. State preemption blocks automated enforcement in some places. Jurisdiction splits mean the worst corridors may be off-limits. Congestion objections are raised in nearly every public meeting, and while they are usually overstated, answering them with data rather than adjectives matters. One-way street conversions and road diets can produce unexpected access problems, which is why before-and-after studies on those specific projects get published and argued over. And the evidence base itself is genuinely mixed, which is the next section.
How Can Cities Start a Vision Zero Program?
Start smaller than most plans assume, and start where the data is worst. A functioning programme that covers one corridor in year one outperforms a strategy document that covers none of it.
- Form a cross-department team. Put transportation, police, public health, emergency services and planning in one room, and check who owns the road where people are dying before writing anything.
- Adopt a target with a date. Zero deaths and serious injuries as the long-term vision, plus intermediate goals, because the intermediate goals are the only part anyone can be held to.
- Analyse five years of crashes. Build the high injury network, add speed data, pedestrian and cycling exposure, and publish the method so residents can argue with the rankings on evidence.
- Engage residents before design. Walk the corridor with people who use it, in daylight and after dark, and record where they actually cross rather than where a crosswalk happens to sit.
- Pick one pilot corridor. Choose somewhere with high severity, high exposure and enough room to measure before and after.
- Fund quick-build changes now. Paint, flex-post islands, curb extensions, a lower speed limit, better lighting, adjusted signal timing. These ship in months and build the credibility that the capital project needs.
- Commit to measurement before construction. Publish the before data, pick the indicators, and set a date to report.
Once the pilot corridor is done, the next real test arrives: reallocate money to the second and third corridors without waiting for a new political cycle. That is where most programmes quietly stop.
Frequently Asked Questions
How does Vision Zero work?
A Vision Zero program works by shifting responsibility for safety from road users to the people who design, build, fund and govern streets. Cities map where fatal and serious crashes concentrate, lower vehicle speeds through redesign rather than signs alone, and treat the highest-risk corridors first. Engineering, targeted enforcement, public education and faster emergency response act as layers, so ordinary human error does not become a death.
What does Vision Zero aim to achieve?
The stated aim is zero traffic deaths and serious injuries. In practice that is a long-term direction rather than a forecast, supported by intermediate targets for the next few years, such as reducing the share of drivers speeding on the high injury network, lowering KSI collisions on treated corridors, and closing the gap in speeds between the posted limit and the design speed of the road.
What are the key strategies of Vision Zero?
The Safe System framework groups them into five pillars: safe speeds, safe roads, safe vehicles, safe road users and post-crash care. Cities working in communities with high levels of traffic violence add two more, equity and community leadership. The framework itself comes from the World Health Organization and United Nations road safety work rather than from Vision Zero, which adopted the Safe System idea and applied it to a stated target.
How is Vision Zero different from Complete Streets, road diets and traffic calming?
Vision Zero is a whole-system policy framework with a stated target, a budget and public accountability. Complete Streets is a design philosophy that rebuilds streets for all users, without necessarily setting a safety target. A road diet and traffic calming are individual interventions, tools that a Vision Zero programme uses. One of them is the plan, the other two are things the plan does to streets.
Has Vision Zero been successful?
The honest answer is mixed, and it depends on the city and the period. Milwaukee reported a 19 percent drop in traffic deaths compared with 2024 and more than 26 percent below its 2022 peak, with a 70 percent drop in speeding on one treated corridor. Sceptics point to per-capita driving rising in Chicago and Los Angeles after adoption, and to pedestrian deaths rising in some adopting cities. Short series and citywide trends make single-episode claims unreliable.
What is the most common reason a Vision Zero program stalls?
The gap between adoption and construction. A council resolution and a public target are cheap and visible, while design review, funding lines and maintenance budgets are slow and invisible. Programs lose momentum when quick-build projects on the worst corridors are not funded, when maintenance is left out of the budget, or when the corridors with the most deaths sit on roads the city does not control.
Conclusion
Vision Zero programs work when a city treats road safety as a design and budgeting problem rather than a behaviour problem, and when it accepts that the test is built streets and lower speeds, not a resolution.
If you are starting something, do three things in order: stand up a team that owns roads, police data, public health and emergency response, publish the high injury network with the method behind it, and fund quick-build changes on the worst corridor within your first budget cycle. Everything after that is sequencing.
This guide was last updated in 2026 as the US Safe System guidance and local camera laws continue to change.