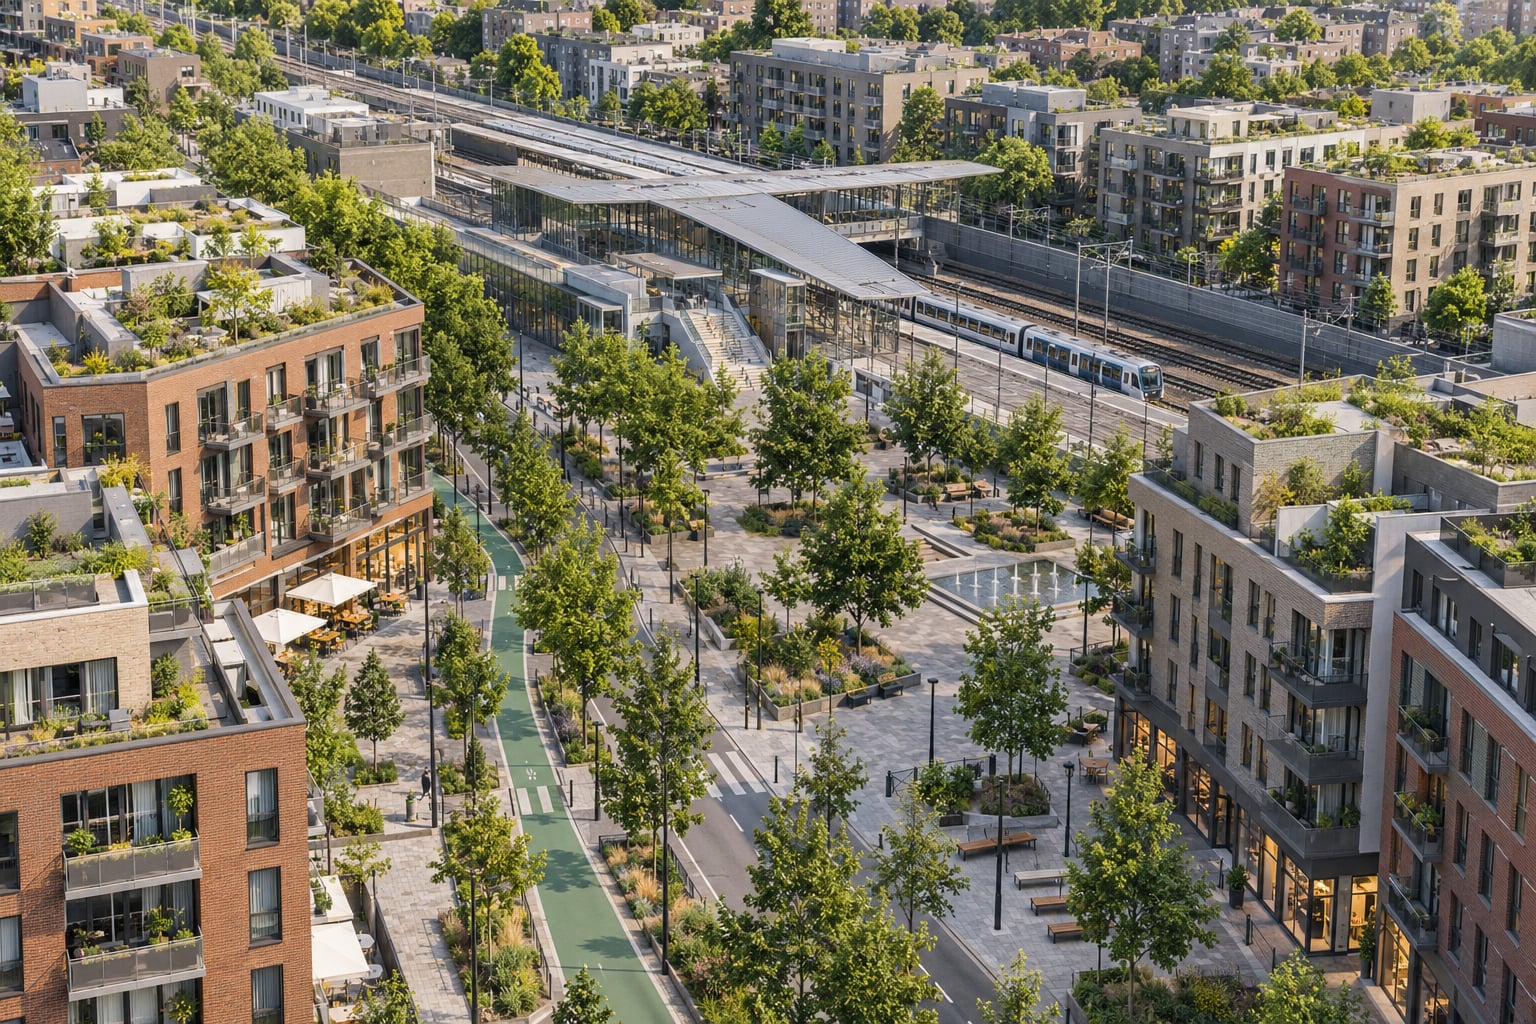
Transit oriented development is a planning approach that concentrates higher-density, mixed-use housing, jobs and services around high-capacity transit stations, usually within a five-to-ten minute walk. It works through a reinforcing loop: new or improved transit makes nearby land more valuable, cities rezoning that land let developers build more, ridership rises, and part of the added land value funds the next round of service and streets.
That loop is the whole idea. Everything else — the density bonuses, the form-based codes, the affordable housing set-asides — is a way of keeping it turning rather than jamming it shut.
People ask about this topic for very different reasons. Planners want to know which zoning tool to reach for. Developers want to know whether a site will pencil. Residents near an announced line want to know what happens to their rent. I try to answer all three without pretending the outcomes are automatic, because they are not.
Table of Contents
- What Is Transit Oriented Development?
- From three Ds to five, six and seven
- How Transit Oriented Development Works
- Why transit alone fails and zoning alone fails
- Who does what in a TOD project
- The Five Main Benefits of Transit-Oriented Places
- The Key Planning Elements That Make Projects Work
- Station typologies matter more than a single formula
- How TOD differs from conventional development
- How Cities Can Plan Around Existing Transit
- What changes when the station already exists
- Low-density cities and the no-transit failure mode
- Transit-Oriented Development and Housing Affordability
- Common Challenges and How to Address Them
- 1. Transit without land-use change
- 2. Rezoning without displacement protection
- 3. Density without services
- 4. One template applied to every station
- 5. Value captured and never returned
- 6. Community engagement as a hearing
- How to Measure Whether Transit-Oriented Development Is Working
- Mobility
- Environment
- Housing and equity
- Economy and safety
- Frequently Asked Questions
- Is transit oriented development only about building density near train stations?
- What is the difference between transit oriented development and a transit-oriented place?
- Does transit oriented development reduce the need for parking?
- What can a city do to prevent displacement near new transit stations?
- What makes TOD successful?
- Conclusion
What Is Transit Oriented Development?
Transit-oriented development, usually shortened to TOD, is the practice of locating housing, employment and daily services close enough to transit stops that walking, cycling and riding replace short car trips. It grew out of the Smart Growth movement of the 1980s and 1990s, which argued that the same amount of public money spent on compact development could support more housing and shorter trips than the same money spent on outward expansion.
It is worth separating TOD from two things it is often confused with. Transit access planning is about getting people to existing stops through shuttles, feeder routes and park-and-ride lots. Station-area planning is the broader project of a district around a station, which may or may not include the density that TOD assumes. TOD without the density is just a bus stop near some shops.
Four ideas do the work inside the label. Land use has to put homes, jobs, schools, shops and care near each other. Density has to be high enough that enough people live near a stop to justify frequent service. Design has to make the walk pleasant, safe and direct rather than a detour through parking lots. Mobility has to include the trips on both ends of the station, not just the wait for the train.
Those four are usually expressed as the five Ds, the framework most widely used to score a station area:
- Density — enough households and jobs within walking distance for frequent transit to run full. Floor-area ratios and units-per-acre are the usual measures.
- Diversity — a mix of housing types, sizes and prices plus a mix of shops, services and employment, so one trip can cover several needs.
- Design — buildings and streets that prioritise pedestrians, with frequent crossings, active ground floors, shade and human-scale frontages.
- Destination accessibility — how many jobs, services and other destinations are reachable from the station area by more than one mode, not just how close the station is to the centroid.
- Distance to transit — the actual walk from the doorstep to the platform, which in bad station design can be several times the straight-line distance.
From three Ds to five, six and seven
The framework started as three Ds — density, diversity and design — before transit planners added destination accessibility and distance to transit. Later versions added a sixth D for the decision-making process that connects land use and transport planning, which matters because in most US cities those sit in different departments under different elected officials. Some researchers add a seventh for the surrounding policy environment, since national housing supply and transport funding shape a station area as much as local zoning does.
Denver’s RTD FasTracks programme is the case most often cited for making this operational, because it sorted stations into types instead of applying one template. Arlington, Virginia is the other, with its station typology system matched to street and block size. Both treat the framework as a diagnostic rather than a checklist.
How Transit Oriented Development Works
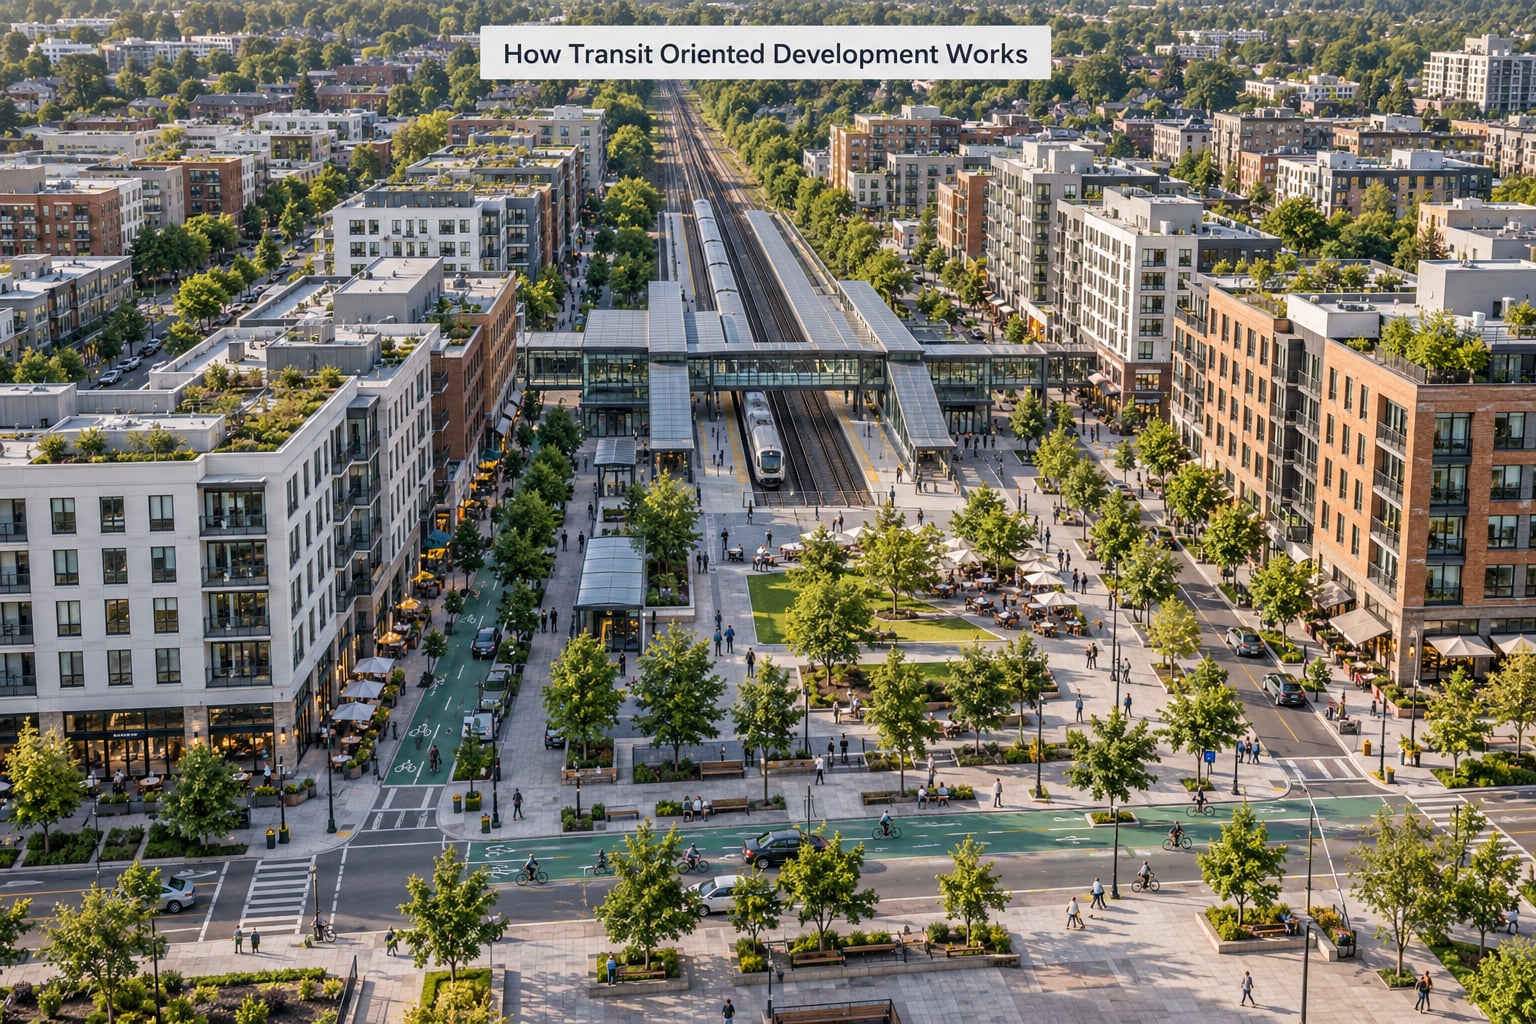
The mechanism is a loop with five steps. Each step can be started on its own and each can fail on its own, which is exactly why so many transit lines underperform.
- Transit investment goes in. A station opens, service frequency rises, or a line is extended. Riders gain access to places they could not reach before.
- Land use changes around the station. The city rezones the station area, raising allowable density, permitting mixed use, reducing parking minimums and shortening block lengths so the walk to the platform is a real walk rather than a hike.
- Developers build to the new rules. Housing, shops and offices go up on the parcels that zoning has now made worth building on. Delivery is slow, often five to ten years from rezoning to occupancy.
- More people live and work within walking distance. Ridership rises on the line, and the rise is concentrated in the peak periods that were previously hardest to staff.
- The transit agency captures part of the new land value. Development rights above stations, tax-increment financing, joint development agreements and land-value capture repay the original investment and fund the next round of service.
Then it starts again with more service. That return leg is the part most frequently missing. A city that builds a station, rezones and then never spends the recovered value on anything leaves the loop open, and the ridership gains plateau after a few years.
| Mechanism | What it changes | How you know it happened |
|---|---|---|
| New or upgraded transit service | Travel time and reliability between places | Ridership by station, by hour of day |
| Station-area rezoning | What can be built and how close to the stop | Permitted versus built density; share of units within a ten-minute walk |
| Developer delivery | Actual household and job count near the station | Certificates of occupancy; ground-floor retail vacancy |
| Walking, cycling and bus connections | First and last mile reliability | Share of riders walking or cycling to the station; crossing delay |
| Value capture and reinvestment | Whether the loop keeps going | Land value per parcel; revenue returned to transit |
Why transit alone fails and zoning alone fails
A new line in a low-density catchment gets built, ridership arrives far below forecast, and the agency cannot run the frequency it promised. The line works exactly as designed; the design assumed a catchment that was never there. Nobody in that scenario lied, and it still fails.
The mirror case is zoning reform with no service. A city upzones a corridor, approves several thousand units, and the buses stay as infrequent as before. Households still cannot get to work, the new residents buy cars, and the housing gets blamed for congestion rather than the missing transit.
Both failures come from treating land use and transport as separate programs with separate timelines, budgets and reporting lines. That is an organisational problem before it is a technical one.
Who does what in a TOD project
| Actor | Controls | What they need from everyone else |
|---|---|---|
| Transit agency | Service, station design, fares, development rights above the platform | Zoning changes and street investment it does not fund |
| City planning and zoning | Use, density, height, block size, parking rules, street design | A firm signal on service frequency, years ahead |
| Developers and builders | What actually gets built, and on what timetable | Predictable entitlements, and a station that opens on schedule |
| Housing and anti-displacement agencies | Affordability tools, tenant protections, public land use | Early notice of the rezoning, before the market moves |
| Residents and businesses | Local knowledge, consent, the political durability of the plan | Real influence in the plan rather than a hearing after it is fixed |
Projects stall where the hand-offs are weak. A station opens two years before the first rezoning takes effect, and the early riders are commuters from outside the district while the local population still has no walkable route to the platform.
The Five Main Benefits of Transit-Oriented Places
Shorter journeys and cheaper household transport. A household that can walk to a grocery store, a school and a station spends less on transport than one driving the same distances. That is the benefit households notice first, and it shows up in their budget before it shows up in a city emissions inventory.
Infrastructure that costs less per resident. Serving a compact district with pipes, sewers, roads, transit and schools is cheaper per person than serving the same population spread across several square miles. This is the strongest financial argument for mayors facing a fiscal squeeze, and it is a long-run argument, not an immediate saving.
Lower car dependence over time. Car ownership is a lagging indicator of a built environment, not a leading one. Most people do not choose to drive less overnight; they move, work or shop somewhere they cannot, and the second car goes away a few years later.
Stronger local economies. Ground-floor retail depends on foot traffic, and foot traffic depends on density within walking distance. Districts built this way tend to hold small businesses better than either a purely residential suburb or a single-use commercial strip. They are not immune to displacement, which is a separate problem discussed below.
Access for people who do not drive. Households without a car, older residents, people with disabilities and teenagers all benefit disproportionately from walkable districts with frequent transit. This is the equity case, and it is the one that holds up best when a city is under budget pressure.
The honest caveat: none of these arrive automatically. Ridership, emissions and affordability gains are all conditional on the density and the service actually being delivered, and every year of delay compounds the cost of catching up.
The Key Planning Elements That Make Projects Work
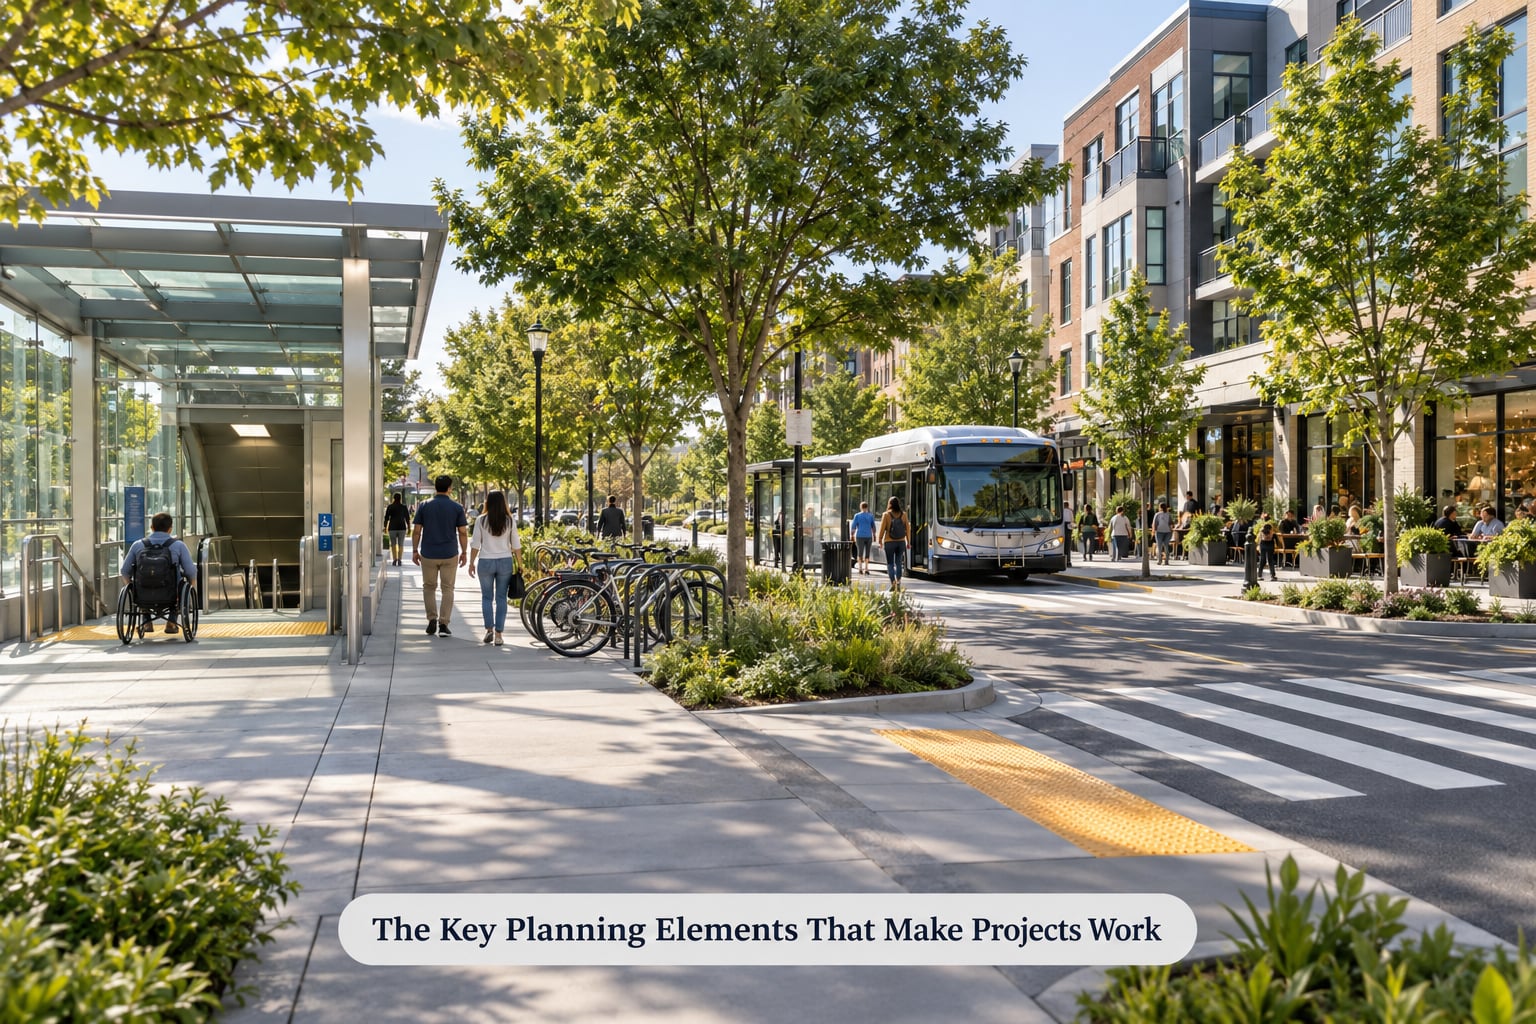
Station placement. Frequency matters more than geometry. A stop on a fifteen-minute interval with good access beats a stop on a two-minute interval behind a six-lane road, and riders respond to reliability far more than they respond to raw travel time savings.
Density matched to service. The usual planning rule of thumb puts roughly 3,000 to 6,000 households within a ten-minute walk of a frequent station, rising for the highest-frequency services. The exact number is less important than the principle: the catchment has to be big enough to fill a bus or train at the frequency you are promising to run.
Mixed use with an active ground floor. Housing over shops only works if those shops have foot traffic, which means entries every 20 to 30 metres rather than a single lobby and a blank wall of parking.
A pedestrian and cycling network that treats the station as the destination. Frequent crossings, shaded sidewalks, protected cycling routes and safe junctions around the entrance matter as much as the platforms themselves, because the first and last mile is where most of the delay lives.
Affordable housing inside the catchment, not adjacent to it. A mix across unit sizes and price bands, achieved through public land, inclusionary requirements and density bonuses rather than through a single affordable-housing project elsewhere in the city.
Public space. Plazas, parks, markets and shade are what turn a corridor into somewhere people stay rather than pass through. The role is not decorative, and it is routinely the first thing cut when a budget tightens.
Integration with wider policy. Climate targets, housing shortage targets, state growth plans and parking reform all have to point the same direction. When a state law mandates a minimum parking space per unit and a city wants a walkable district, one of them has to give.
Station typologies matter more than a single formula
| Station type | Typical setting | What the plan has to get right |
|---|---|---|
| Downtown | Central business district, regional hub | Pedestrian priority at street level, limited parking, high-capacity interchange |
| Urban centre | Dense mixed-use corridor | Continuous active frontage, mid-rise infill, slow or no through traffic |
| Neighbourhood | Existing residential area, often with family housing | Retaining existing homes, adding density gently, school and childcare capacity |
| Main street | Suburban or small-town commercial strip | Reusing parking and storefronts, keeping small businesses through the transition |
| Commuter town centre | Outer end of the line, lower density | Housing and services near the stop, otherwise it stays a park-and-ride |
How TOD differs from conventional development
| Dimension | Conventional low-density development | Transit-oriented development |
|---|---|---|
| Density | Low, single-use parcels | Mid- to high-rise, small lots, concentrated near stops |
| Land use mix | Separated uses, low interaction | Mixed use within a short walk of the station |
| Parking | Minimums set per use, surface lots, free parking | Reduced or removed minimums, shared and structured parking, priced where it remains |
| Typical trip length | Long, often motorised, often single-occupancy | Short, more of them walkable or cycleable |
| Housing type | Detached and low-rise | Apartment, townhouse and mixed-income, plus retained existing housing |
| Infrastructure cost per resident | High, because networks are long and thin | Lower per resident, because density shares the same pipes and streets |
How Cities Can Plan Around Existing Transit
Most cities that want TOD do not have a new line coming. They have a station that has been there for thirty years and a catchment that never densified. The process in that situation is different, and it is slower.
- Map the station area honestly. Count existing households, jobs, parcels, vacancy, pedestrian conditions and where people currently walk to park. Build a real catchment rather than drawing a circle.
- Understand the transit service first. Frequency by hour, span of service, reliability and planned changes set the realistic density ceiling. Zoning for a catchment the agency cannot serve is the most common error in this list.
- Change the rules in the right order. Use, density, height and parking usually need a plan amendment. Overlay zones, form-based codes and development agreements can act faster where a full rezoning is not politically available in the near term.
- Fix the public realm at the same time. Sidewalks, crossings, cycling connections, lighting and station entrances should be funded on the same schedule as the zoning change, not five years later.
- Protect the people already there. Apply tenant protections, small-business leasing programmes and affordable housing requirements at the moment of rezoning, because the market reacts to the plan before the first shovel.
- Sequence delivery. Public land parcels and small infill sites go first because they set the tone and prove the street can work. Large sites follow once the service and the public realm are real.
What changes when the station already exists
Retrofitting TOD is mostly about removing barriers rather than creating conditions. Existing residents and businesses are already there, which means the equity questions are not hypothetical: they are about specific people and specific leases.
It also means the gains take longer to show. Station areas that densify gradually carry a mix of income and tenure for years, which slows the visible change but makes the neighbourhood more durable than one that turns over in five.
Low-density cities and the no-transit failure mode
Discussion of this topic keeps circling one point: without meaningful service, TOD produces more community anger than benefit. That is a fair criticism. A city with no frequent transit cannot copy a model built on walking distance to a high-frequency stop.
What usually works instead is a staged approach: improve the bus network and frequency first, concentrate modest density along the strongest corridors, and upgrade to higher-capacity transit once the ridership base exists. Some low-density cities also get better results by improving regional rail access and station-area planning in the handful of places that already have density.
Transit-Oriented Development and Housing Affordability
Transit access is worth a measurable amount of money to a household, and households that cannot afford to live near transit get none of it. That is the equity case for including affordable housing inside station areas rather than treating it as a separate social programme.
The countervailing effect is real and well documented. New transit investment tends to raise land values, and so do the housing supply increases that sometimes accompany it. Skeptics trust data on rents and displacement more than they trust ridership forecasts, and in the communities most affected, they are usually right to be cautious.
The practical answer is that affordability has to be secured before the value rise, not after it. The tools that work:
- Public land — the strongest tool available, because the city controls the site before prices move. Santa Fe’s railyard redevelopment is the reference case most planners cite.
- Inclusionary housing requirements — a set share of units in developments above a size threshold, permanently affordable, with a real number attached rather than a goal.
- Community land trusts — land stays in community hands while residents build equity, which protects affordability across resale rather than only for the first tenant.
- Density bonuses — extra height or floor area in exchange for affordable units, letting the private market fund part of the affordable stock.
- Dedicated housing funds and grants — national and state programmes aimed at affordable housing near transit exist specifically because the market will not supply it otherwise.
- Tenant protections — right-to-return, relocation assistance, legal counsel and rent stabilisation measures applied in the station area.
The Urban Institute’s recent work on generating affordable TOD documents the same pattern: without a mechanism that commits affordability at the rezoning stage, the units that get built near transit are overwhelmingly market-rate. The proximity benefit flows to whoever can pay the closest rent.
Common Challenges and How to Address Them
Six failure modes account for most of the disappointing TOD outcomes, and every one of them has a known response.
1. Transit without land-use change
The line opens, the catchment never densifies, and ridership lands far below forecast. The response is to fix the zoning and the first mile in parallel, funded and scheduled together, not to lament the forecast later. The community version of this complaint — a zoning change with no service — has the same answer running in reverse.
2. Rezoning without displacement protection
The plan is good, the market reacts, and the residents it was meant to serve leave. The response is to tie inclusionary requirements, right-to-return and small-business leasing to the rezoning resolution itself, so the protection is a condition of the upzoning rather than a later addition.
3. Density without services
Thousands of homes arrive with no school capacity, no childcare and no grocery. The response is a capital plan that grows with the housing, published at the same time, and a phasing rule that ties occupancy to service capacity.
4. One template applied to every station
A commuter station in a low-density suburb is treated exactly like a downtown hub, and the plan reads as generic as it is. The response is station typologies, with each type given its own density range, street section and public realm standard.
5. Value captured and never returned
The agency sells development rights, books the revenue, and the money does not come back to service or the street. The response is a published commitment that a defined share of value capture funds frequency, accessibility and the first mile, with annual reporting on where it went.
6. Community engagement as a hearing
Plans arrive finished, residents object, and the political durability of the project collapses. Practitioners describe this as engagement fatigue, and it is a fair description. The response is to move involvement upstream, before the plan is drafted, and to publish what was changed as a result.
How to Measure Whether Transit-Oriented Development Is Working
If you cannot measure it, you cannot defend it at budget time, and the first budget cut will take the public realm work. A useful station-area scorecard has four layers.
Mobility
Ridership per station and per hour, share of riders arriving on foot, by bicycle or by bus, transfer reliability, and average walking distance from home to platform. The last-mile share is the most diagnostic number: if most riders arrive by car, the catchment is not where the plan assumed.
Environment
Vehicle miles travelled per household, vehicle miles per resident within the catchment, transit mode share, and transport emissions per capita compared with the city baseline. Measure against a control area if you can, because a rising transit share can just as easily reflect service cuts elsewhere as growth around the station.
Housing and equity
Units delivered versus units permitted, rents and home prices against the city median, the share of affordable units in the catchment, the share of new households that are car-free, and displacement indicators such as eviction filings and business turnover on the main street. Report the trend from the year before the plan, not from today.
Economy and safety
Ground-floor vacancy, business openings and closures by category, jobs located within the catchment, pedestrian and cyclist injury counts, and how residents rate the district in annual surveys. Residents rate safety and noise more sharply than they rate anything else, and that shows up in the data long before it shows up in a plan amendment.
The measurement layer is more accessible than it used to be. Open transit data, in the widely used GTFS format, plus parcel and census data, is enough for a small team to build a station-area dashboard without a consultant. Several cities now publish exactly this. For a planner or a civic technologist, that dataset is usually the fastest way to find out which stations are quietly failing.
Frequently Asked Questions
Is transit oriented development only about building density near train stations?
No. Density can support transit, but successful transit oriented development also coordinates housing, jobs, streets, walking and cycling routes, public spaces, affordable access, and station design. A dense district with poor crossings and a two-car-deep parking lot between the buildings and the platform is a parking lot with apartments, not a TOD station area.
What is the difference between transit oriented development and a transit-oriented place?
Transit oriented development describes the policy and development approach of coordinating land use and transportation around high-capacity transit. A transit-oriented place is the resulting physical outcome of that work. The distinction matters because a place can be walkable and transit-friendly without the policy apparatus, and a policy can exist on paper without producing a place.
Does transit oriented development reduce the need for parking?
It can reduce parking demand where residents and visitors have reliable transit, safe walking and cycling routes, and nearby daily services. However, parking policies should reflect local conditions rather than a national formula, since a neighbourhood with low car ownership and a commuter station at the end of a line need very different approaches to parking and drop-off.
What can a city do to prevent displacement near new transit stations?
Cities can act before prices rise by using public land, inclusionary housing requirements, community land trusts, affordable housing funds, tenant protections, property-tax relief, and grants for small businesses. The critical detail is timing: these tools work when they are attached to the rezoning decision, and lose most of their power when they arrive after prices have already moved.
What makes TOD successful?
Four things: a service frequency the density can actually support, zoning that permits the right mix of uses and building types, a safe and direct walking route from the doorstep to the platform, and protections for the people already living there. TOD consistently underdelivers when any one of those is missing, regardless of how good the station building looks.
Conclusion
The first action is small and unglamorous: study the station area as one connected system of land use, mobility, housing and public realm, rather than as a transit project with some buildings nearby. Map who lives there now, what the service actually runs, where people cross the street, and which parcels the city already owns.
Everything that follows — the zoning change, the density, the affordable housing, the value capture agreement — gets easier when that study is done first and done honestly. Most projects that disappoint did not fail on ambition. They failed because the land use and the transit were never on the same schedule, and nobody was accountable for the gap.