Fleet electrification saves money in four places: the cost of energy per mile, the cost of maintenance, the incentives and credits that offset the higher purchase price, and the savings you get by controlling when and how vehicles charge. The reason it works better for fleets than for a single commuter car comes down to volume — a fleet covers hundreds of miles per vehicle per year, buys vehicles in batches, and parks in one place overnight.
That combination turns a modest per-mile advantage into a five-figure line item, and it is why municipal and commercial operators keep finding that the business case improves with scale. The catch is that the savings depend entirely on your duty cycle, your utility rate, and how disciplined you are about charging.
Table of Contents
- How Fleet Electrification Saves Money
- The Main Sources of Fleet Electrification Savings
- 1. Lower energy cost per mile
- 2. Lower maintenance costs
- 3. Incentives, credits and grants
- 4. Managed charging and energy cost control
- Which Fleet Vehicles Benefit Most?
- How to Calculate the Financial Payback
- Step 1: annual energy cost
- Step 2: annual maintenance delta
- Step 3: the capital premium
- Step 4: payback in years
- Charging Infrastructure and Operating Costs
- When Electrification May Not Save Money
- How to Build an Electrification Plan That Works
- Frequently Asked Questions
- What does fleet electrification mean?
- Do electric fleet vehicles really cost less to run?
- What makes fleet electrification payback happen fastest?
- Do maintenance costs actually fall for electric fleet vehicles?
- How does charging affect daily fleet operations?
- Should incentives be included in the fleet electrification business case?
- Conclusion
How Fleet Electrification Saves Money
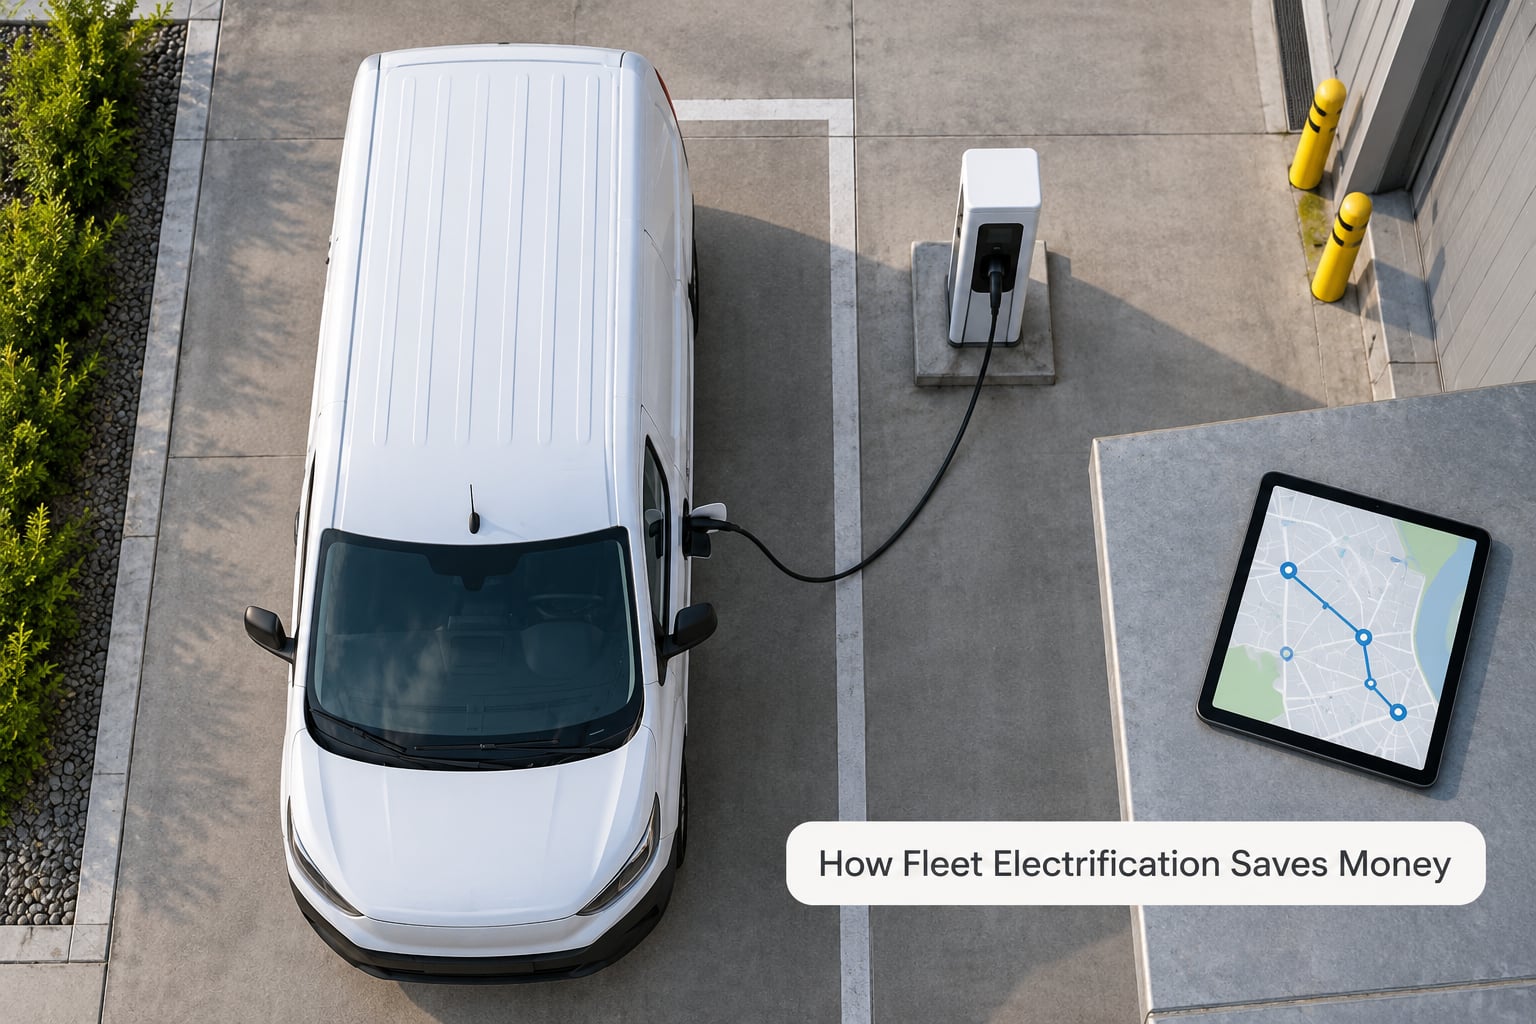
Electric fleet vehicles cost less per mile to run, need less routine maintenance, qualify for incentives that shrink the price premium, and can charge cheaply overnight when electricity is off-peak. Those four levers together usually cover the higher upfront price within a few years of high-mileage operation.
Fleet electrification means replacing the gasoline or diesel vehicles in your fleet — sedans, vans, buses, trucks and municipal equipment — with battery electric vehicles, plus the chargers, electrical work and software needed to support them. It is not a software upgrade or a fuel swap; the depot has to change with the vehicles.
Fleets are unusually good candidates for three structural reasons. First, annual mileage is high, so every per-mile saving multiplies fast. Second, routes are repeatable, which makes energy modelling reasonably accurate instead of speculative. Third, vehicles return to the same depot, which means charging can be scheduled in one place overnight rather than scattered across public chargers.
Compare that to a private car driven 8,000 miles a year, where the same per-mile saving barely moves the household budget. A fleet vehicle covering 12,000 to 20,000 miles a year turns the identical math into a line item a finance team has to take seriously.
The Main Sources of Fleet Electrification Savings
Four cost levers account for nearly all of the difference between an electric fleet and its combustion predecessor. Here is what each one is worth and where the numbers come from.
1. Lower energy cost per mile
Electricity carries more energy per dollar than gasoline or diesel, and electric drivetrains convert more of it into motion. Published fleet estimates land electric light-duty vehicles at roughly $0.03 to $0.05 per mile for energy, against figures several times higher for gasoline vehicles.
Portland, Oregon reported a fuel cost reduction from $0.29 per mile to $0.03 per mile after pairing fleet vehicles with on-site solar, a figure the Electrification Coalition published in a May 2026 case study. One public agency buyer quoted in our research described per-mile fuel reductions in the 80 to 90 percent range for light-duty EVs once charging was in place.
Here is a cost-per-mile comparison using typical US inputs. Treat it as a planning range, not a quote, since fuel prices and commercial electricity rates vary widely by region.
| Cost per mile | Battery electric | Gasoline | Diesel |
|---|---|---|---|
| Energy | $0.03 to $0.05 | $0.10 to $0.14 | $0.09 to $0.13 |
| Routine maintenance | $0.02 to $0.04 | $0.07 to $0.10 | $0.08 to $0.12 |
| Typical total running cost | $0.05 to $0.09 | $0.17 to $0.24 | $0.17 to $0.25 |
2. Lower maintenance costs
An electric powertrain has no oil, no exhaust system, no turbocharger, no starter motor and no multi-speed transmission. That removes most of the scheduled service an internal combustion engine vehicle needs, and vendor analysis has put routine maintenance for a comparable electric vehicle at roughly half the cost of its combustion equivalent.
Regenerative braking stretches brake pad and rotor life further, because the friction brake does far less of the work on a stop-and-go route. Fleet operations also report cutting their oil and fluid service visits, which means fewer bays occupied and fewer vans out of service on a Tuesday morning.
Do not treat this as zero maintenance. Tires still wear, suspension still needs attention, and the cooling loop and brake fluid still have service intervals. The honest framing is that the tail of routine service shrinks, not that it disappears.
3. Incentives, credits and grants
Incentives do not reduce operating cost, but they cut the purchase premium that everything else has to pay back. The federal commercial clean vehicle credit and the alternative fuel vehicle refueling property credit have been the two most-cited programs, alongside state clean-fuels programmes and utility rebates.
Regional programmes matter as much as federal ones. Portland’s figures depend heavily on PCEF funding and Oregon Clean Fuels credits, and our research found trucking operators reporting per-mile credits under Clean Fuels programmes that can push variable cost below zero for some lanes.
One important caveat for 2026: incentive values and eligibility change with federal and state policy. Any business case should show the scenario with incentives and the scenario without, so you are not making an argument that depends entirely on a programme you might lose.
4. Managed charging and energy cost control
This is the lever most operators underestimate, and it is where a good deal of the extra value sits. Commercial tariffs often price electricity an order of magnitude higher during peak hours than overnight. A fleet that plugs in at 11pm on a time-of-use rate pays a fraction of what the same energy costs at 5pm.
Demand charges work the other way. Adding several high-power chargers at once can spike your peak kW demand, and a demand charge on that spike can quietly consume the fuel savings you budgeted for. RMI has reported that managed charging combined with on-site solar and batteries can cut fleet electricity bills by up to 30 percent while shortening charging time.
Bidirectional charging, sometimes called vehicle-to-grid, takes this further: vehicles charge when power is cheap or available and discharge into the building during the expensive peak. On a campus with a sharp daytime peak, that turns parked vans into a distributed energy resource rather than just a load.
Which Fleet Vehicles Benefit Most?
The vehicles with the strongest economics are the ones driven most, on the most predictable routes, with the most stop-and-go driving. Regenerative braking does its best work in exactly that environment, and predictable routes mean you can size chargers with confidence.
| Duty cycle | Why it works | Watch out for |
|---|---|---|
| Last-mile delivery vans | High mileage, urban stop-and-go, overnight depot charging | Payload and range on long rural legs |
| Transit and school bus | Fixed routes, long dwell times at depot for charging | Schedule padding and seasonal cold-weather range |
| Municipal service and inspection | Predictable daily routes, public-fleet funding available | Specialty equipment that has no electric version yet |
| Police and parking enforcement | Idle-heavy duty cycle, regen cuts brake wear sharply | After-hours routes with unplanned charging needs |
| Light-duty sedans and pickups | Widest model availability, simplest charging | Lower mileage means a slower payback |
| Long-haul and heavy-duty trucks | Largest absolute fuel spend to attack | Route fit, dwell time, charger power and residual risk |
The pattern to notice: the best first vehicles are not always the biggest. A delivery van doing 14,000 predictable urban miles a year usually has a cleaner business case than a heavy truck on unpredictable long-haul routes, because the charging, payload and residual-value risks are all smaller.
How to Calculate the Financial Payback
Payback is a single number you can compute yourself, and you can defend it line by line. Work in four steps: energy, maintenance, capital, and incentives.
Step 1: annual energy cost
Electric: annual miles divided by miles per kWh, multiplied by your rate per kWh. Combustion: annual miles divided by miles per gallon, multiplied by your price per gallon. Take the difference and multiply by the number of vehicles.
Step 2: annual maintenance delta
Estimate routine service cost per mile for each powertrain from your own maintenance history, subtract, and multiply by annual miles per vehicle. Include tyres and any towing you currently pay for; leaving them out is a common way vendor models look rosier than reality.
Step 3: the capital premium
Vehicle price difference plus charging hardware and installation plus any electrical service upgrade, less incentives and grants. That is what the operating savings have to recover.
Step 4: payback in years
Capital premium divided by annual operating savings. If that number sits near or beyond the length of your vehicle replacement cycle, the case is not there yet for that vehicle class.
Here is a worked example using illustrative inputs, so you can see the shape of the calculation. Forty vans, each covering 12,000 miles a year. Electric at 3 miles per kWh and $0.13 per kWh gives 4,000 kWh and $520 a year. The same van as a diesel at 18 miles per gallon on $4.10 a gallon burns 667 gallons, or $2,733 a year. Energy saving is about $2,213 per van.
Add a maintenance delta of $0.05 per mile across 12,000 miles, or $600 per van, and you get roughly $2,813 saved per vehicle per year. Across 40 vans that is $112,520 annually. Against a premium of $8,000 per van after incentives, or $320,000, payback is under three years. Now add $150,000 of chargers and installation, and the total capital rises to $470,000, pushing payback to roughly four years.
Change the assumptions and watch it move. Halve the annual mileage and the electricity rate doubles the payback. That sensitivity is exactly what a finance team should be pressing on.
A full total cost of ownership model has to carry more lines than energy and maintenance. Here is how electrification typically moves each one.
| TCO category | Effect of electrification |
|---|---|
| Acquisition | Rises, partly offset by incentives |
| Energy | Falls substantially |
| Maintenance | Falls, mostly in routine service |
| Insurance | Roughly flat, worth re-quoting |
| Depreciation and residual | Uncertain; wider spread between retained and resale values |
| Taxes and fees | Check local registration weight and use-based fees |
| Charging and electrical | New category: hardware, install, demand charges |
Charging Infrastructure and Operating Costs
Chargers, not vehicles, are usually what slows a fleet down and what blows the budget. A construction fleet buyer in our research put it plainly: the port is the constraint and the line item that gets underestimated. Another common thread is difficulty estimating how many ports a fleet actually needs before it owns a single vehicle.
Level 2 charging at 7 to 11 kW is the right default for overnight depot use where dwell time is long. DC fast charging is for routes with short dwell times or vehicles that must turn quickly, and it costs far more per port. Qmerit published hardware figures in 2024 that still give a useful sense of the spread: Level 2 hardware in the range of $400 and up, installation around $800 to $2,000, and DC fast charging ports quoted from roughly $18,000 to well above $300,000 each. Treat those as dated vendor ranges, not current quotes.
Four things change the operating cost picture more than people expect:
- Tariff design. A time-of-use rate rewards overnight charging. A flat commercial rate does not, and the savings shrink accordingly.
- Demand charges. Charging every van at once creates a demand spike. Staggered start times or managed charging software can flatten it.
- Charging losses. Some energy is lost as heat between the panel and the battery. Budget roughly a tenth of your kWh for losses rather than assuming perfect efficiency.
- Electrical capacity. The utility study comes before the vehicle order, not after. Existing service capacity, transformers and panel upgrades often cost more than the vehicles did.
Verify these four things before committing to a charging strategy, and the model stops being guesswork. Ask the utility for your twelve months of interval usage, get the tariff sheet, request a capacity and upgrade assessment, and run your first month of charging against a real load profile rather than a spreadsheet assumption.
When Electrification May Not Save Money
Some fleets get a weak or negative return, and it is worth saying so plainly before anyone signs anything. Low-mileage vehicles are the clearest case: at 4,000 miles a year the operating saving barely dents the purchase premium. Fleets with unpredictable routes are next, because you cannot schedule charging or size the battery with confidence.
Expensive or unreliable electricity flips the math too. Some rural and industrial tariffs carry high delivery charges and steep demand charges, and an area with frequent outages adds a resilience cost that no fuel savings can offset.
Long-distance and specialised heavy-duty work has its own risk profile. Towing, gradients, high payloads and route requirements can exceed available range, and residual value on a truck with an unusual duty cycle is harder to defend at trade-in. Forum discussions among fleet buyers keep surfacing the same two worries: battery replacement cost being quietly excluded from vendor models, and resale value uncertainty when policy support changes.
Major electrical upgrades can be the item that sinks an otherwise sound project. A single-phase service replacement at an old depot can cost more than a year of fuel savings.
If some of this describes your fleet, the fix is sequencing rather than abandoning the plan. Replace on the natural cycle, start with one high-confidence duty cycle, add chargers in stages, and revisit the model once you have six months of real utility data. Many operators reached a positive case that way rather than on paper in year one.
How to Build an Electrification Plan That Works
A working plan follows a fixed order, and skipping a step is how projects stall.
- Pull the telematics data. Twelve months of miles per vehicle, route lengths, dwell time and idle hours. Group vehicles by duty cycle, not by department.
- Build the cost model per duty cycle. Not one average number. Parked sedans and high-mileage vans deserve different models.
- Rank vehicles by payback and risk. Start where the return is clear and the charging fit is simple.
- Talk to the utility early. Tariff options, capacity assessment, upgrade timelines and any fleet or managed-charging programmes on offer.
- Run a pilot. A handful of vehicles and one charger type, tracked honestly for six months.
- Train drivers and maintenance staff. Drivers need charging habits and route planning; technicians need battery-safe service procedures.
- Track actual results. Compare achieved cost per mile against the model, and publish the gap. The gap is where the next version of the business case comes from.
One more step for cities and utilities specifically: connect charging and telematics data to the energy management and open data systems you already run. Charging schedules, state-of-charge data and peak demand profiles fit naturally into a city’s energy reporting, and for a smart city team that integration is often worth more than the fuel saving itself.
Frequently Asked Questions
What does fleet electrification mean?
Fleet electrification means replacing the internal combustion vehicles in a fleet — sedans, vans, buses, trucks and municipal equipment — with battery electric vehicles, plus the chargers, electrical upgrades and charge management software needed to run them. It covers the vehicles, the depot and the operating plan, not just the purchase order.
Do electric fleet vehicles really cost less to run?
For high-mileage fleets, usually yes. Energy cost per mile typically falls into a range of a few cents against roughly double that for gasoline or diesel, and routine maintenance costs are also lower. The advantage shrinks at low mileage, on unpredictable routes, or on tariffs with steep demand charges, which is why the payback has to be calculated per duty cycle rather than assumed.
What makes fleet electrification payback happen fastest?
Three things drive payback: annual mileage, energy cost per mile and the size of the capital premium. High-mileage vehicles on fixed routes pay back fastest because savings accumulate quickly and charging is easy to schedule. Incentives, managed off-peak charging and on-site solar shorten the timeline further by shrinking the premium and the per-kWh cost.
Do maintenance costs actually fall for electric fleet vehicles?
They do, mostly in routine service. There is no engine oil, exhaust system, turbocharger or multi-speed transmission to service, and regenerative braking extends brake pad and rotor life on stop-and-go routes. Industry analysis puts routine maintenance for a comparable electric vehicle at roughly half the combustion equivalent. Tires, suspension and brake fluid still need attention.
How does charging affect daily fleet operations?
Planned overnight charging at a depot mostly disappears from the workday, but it does replace refuelling stops with plug-in time, and DC fast charging occupies short windows a route has to plan around. The usual impact is added schedule padding on transit and delivery routes plus staff training. Managed charging can usually recover most of that time by spreading loads overnight.
Should incentives be included in the fleet electrification business case?
Include them, but model the case twice: once with incentives and once without. Incentive values and eligibility change with federal and state policy, so a case that collapses without them is fragile. Clean fuels programmes, utility rebates and local grants can shift the answer materially, particularly for public-sector fleets, but the operating savings should carry the argument.
Conclusion
Start by pulling twelve months of mileage and duty-cycle data and ranking your vehicles by payback. That analysis costs nothing, it settles most of the arguments before money is spent, and it tells you whether your first purchase should be a delivery van, a bus or nothing at all.