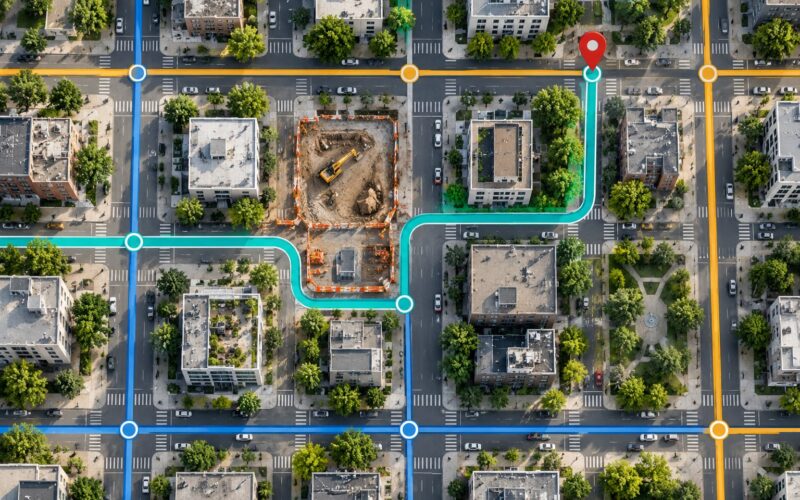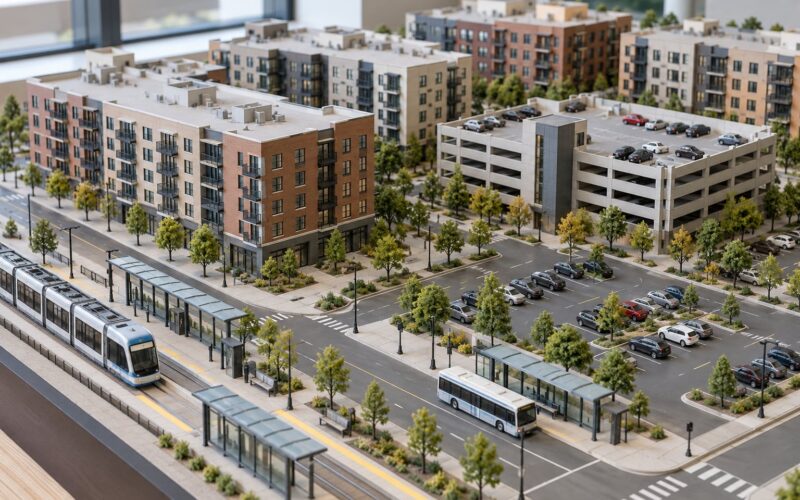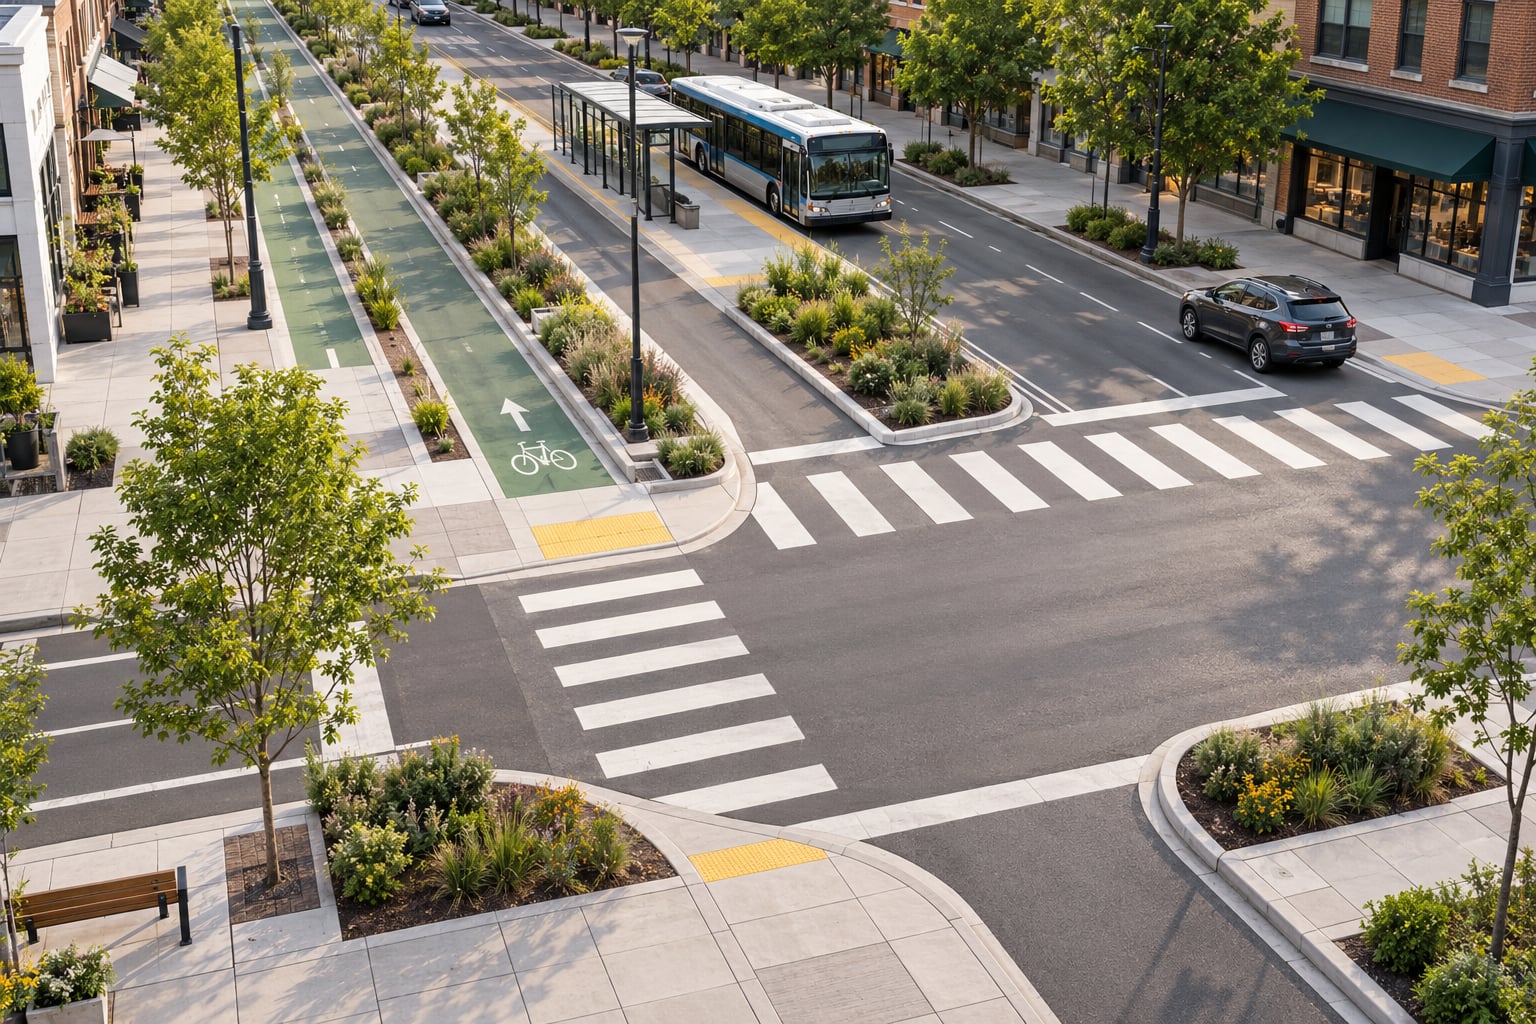
Complete streets design reduces crashes by changing the street itself rather than the driver. Safe outcomes come from combining lower operating speeds, clearer right-of-way decisions, fewer conflict points, and physical separation for people outside vehicles. Signs, enforcement and education help, but they rely on behaviour that a wide boulevard was designed to make difficult in the first place.
That distinction matters because crash counts do not move because of good intentions. They move because the geometry, the speed environment and the amount of space each user occupies are reworked, then the results are counted before and after. A city that repaints lanes, posts a lower speed limit sign, and calls it complete streets usually sees little movement in the numbers. A city that reallocates right-of-way tends to see something else.
Table of Contents
- How Complete Streets Design Reduces Crashes
- What Is Complete Streets Design?
- The terms you will meet in the sources
- How Does Complete Streets Design Reduce Crashes?
- What the evidence says, and where it is thin
- Which Complete Streets Design Elements Improve Safety?
- Protected bicycle lanes
- Continuous sidewalks and accessible curb ramps
- Pedestrian refuge islands
- Raised crosswalks and raised intersections
- Speed humps, tables and raised crossings
- Curb extensions and tighter corner radii
- Access-point management and daylighting
- Transit stop design
- Why Geometry Beats Signs and Enforcement
- Why Are Pedestrians, Cyclists, and Transit Riders Especially Important?
- How Do Complete Streets Affect Vehicle Drivers and Traffic?
- How Complete Streets Design Reduces Crashes at Intersections
- How Can a City Measure Whether Crash Rates Are Falling?
- How Should Cities Plan and Implement a Complete Street?
- What Are the Common Mistakes in Complete Street Projects?
- Frequently Asked Questions
- Do complete streets always reduce traffic crashes?
- What is the safest speed limit for a complete street?
- Are protected bike lanes safer than painted bike lanes?
- Can complete streets make traffic congestion worse?
- How long does it take for a complete street project to show safety results?
- Should every city street be redesigned as a complete street?
- Conclusion
How Complete Streets Design Reduces Crashes
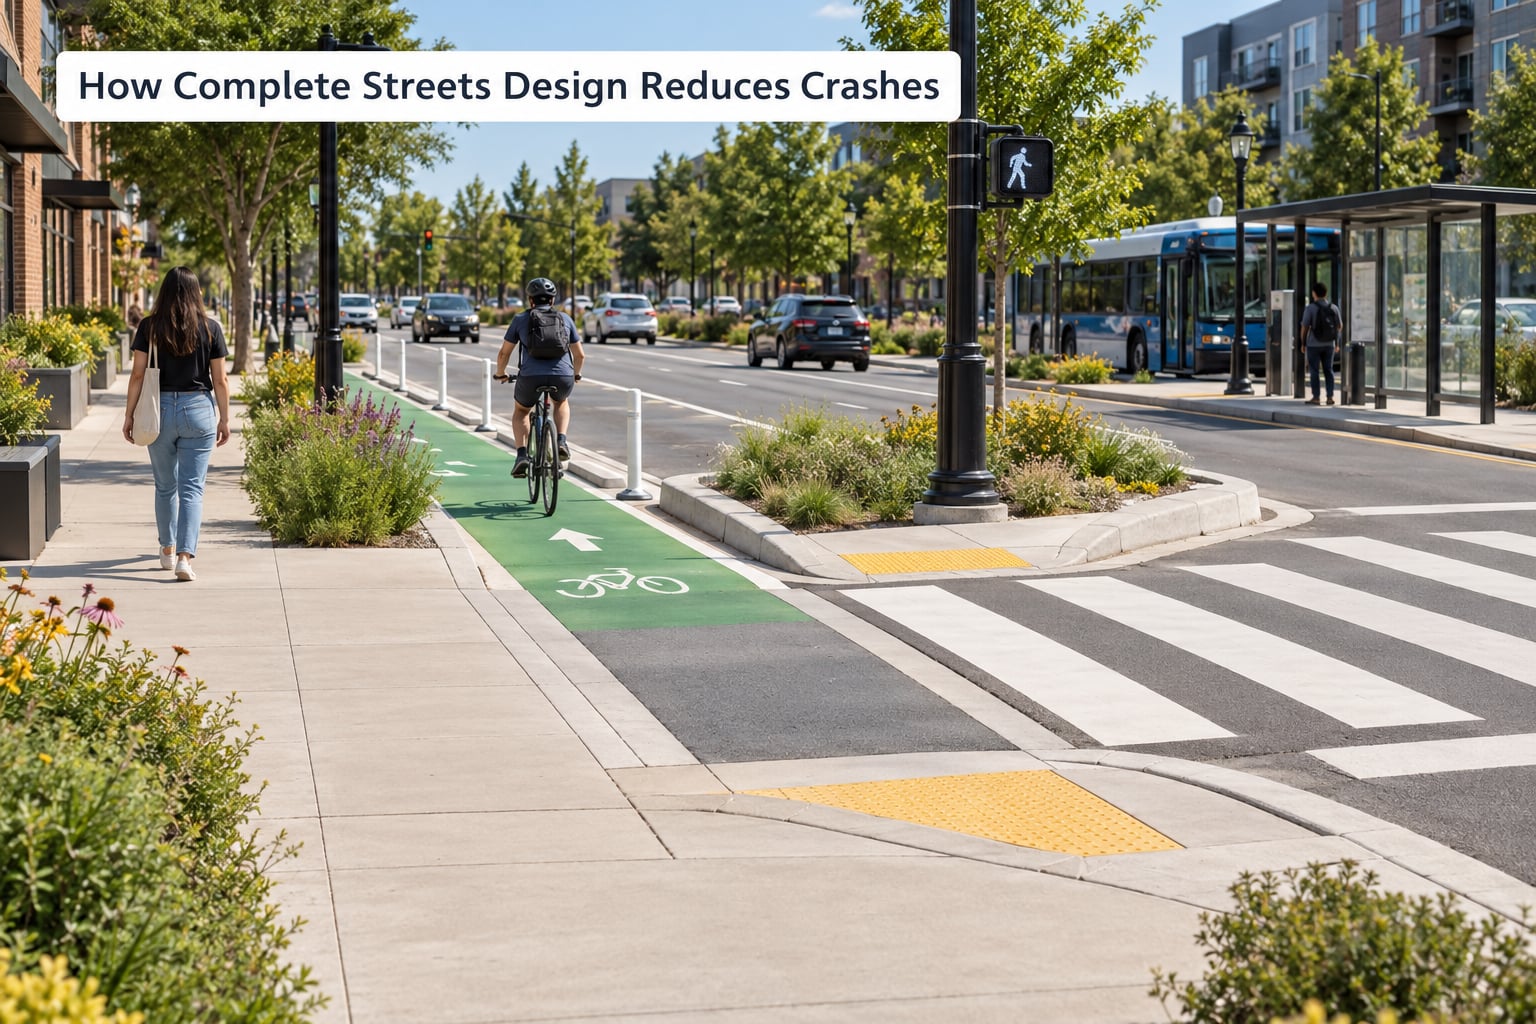
Complete streets design reduces crashes through a chain of linked changes: it sets a lower and more consistent operating speed, cuts the number of lanes people must cross, shortens and brightens crossings, gives people outside vehicles protected space, and softens the severity of whatever crashes remain. Each link attacks a different part of the crash sequence, which is why the combined effect is larger than any single treatment.
The direct answer is not that complete streets make drivers more careful. They make the risky moves shorter, rarer, and less energetic. A turning vehicle meets a pedestrian at a tighter corner radius and a slower speed. A bicyclist rides in a lane a driver cannot drift into. A crossing sits where a person can see it from the sidewalk, not around the corner of a parked van.
What Is Complete Streets Design?
Complete streets design is the practice of building and redesigning roadways so every user has safe, comfortable, dedicated space: people walking, wheeling, riding, rolling on micromobility devices, waiting for transit, driving, or moving freight. The emphasis is on access, not on speed of movement for any single mode.
A complete street includes sidewalks with accessible crossings, bicycle facilities separated from motor traffic, transit stops that board without stepping into a live travel lane, and a roadway whose speed environment suits the surrounding land use. Residential blocks, commercial main streets and downtown arterials get different treatments, but the same underlying principle applies.
The important distinction is between a coordinated transportation system and a collection of unrelated road projects. A city that installs a bike lane on one block, a flashing beacon on another and a painted shoulder on a third has three projects. A city that sequences them so a person can travel the full corridor at every point has a network, and networks are where the safety returns show up.
The terms you will meet in the sources
Reading the primary literature is easier once a handful of terms are defined. A complete street is a street built and redesigned for safe access by every user, per the National Complete Streets Coalition’s framing. A road diet converts a roadway with more lanes than it needs into one with fewer, wider space reallocated to sidewalks, bicycle facilities, planting or medians. Operating speed, often the 85th percentile speed, is the speed at or below which 85 percent of vehicles travel; it describes what drivers actually do, not what a sign says. A crash modification factor is the expected change in crashes from a given countermeasure, published with its uncertainty in the FHWA CMF Clearinghouse. Fatal and serious injury crashes, abbreviated KSI, are the subset most design choices actually move. The safe systems approach treats deaths and serious injuries as preventable and designs the whole system around that goal rather than around human error.
How Does Complete Streets Design Reduce Crashes?
Eight mechanisms account for most of the measured effect. Planners talk about them separately because each one can be designed, priced and evaluated on its own.
| Mechanism | What changes | Why crashes fall |
|---|---|---|
| Operating speed | Posted limit and actual 85th percentile speed | Lower speeds shorten exposure time and cut impact energy dramatically |
| Conflict exposure | Number of lanes and driveways a user must navigate | Fewer crossing and turning conflicts per block |
| Physical separation | Buffer, barrier or grade separation between modes | Makes each user predictable to the others |
| Visibility | Daylighting, lighting levels, sight line distance | Drivers see people sooner, so they react earlier |
| Crossing distance | Street width to be traversed | Shorter exposure inside the conflict zone |
| Intersection complexity | Turning movements, radii, signal phasing | Simpler intersections produce fewer and slower conflicts |
| Transit reliability | Stop location, boarding island design, signal priority | Fewer last-minute stops and dooring, safer merges |
| Predictability | Consistent geometry along a corridor | Drivers and micromobility users behave consistently |
What the evidence says, and where it is thin
The numbers that circulate most widely are usually reported without a corridor name or a baseline year, which makes them hard to use. Three better anchors exist. A 2015 complete streets factsheet describing a Main Street redesign reports automobile traffic up 24 percent while crashes fell 66 percent and injuries fell 60 percent, which is the pattern you would expect when volume and safety move independently. A Columbia academic review found roughly 70 percent of complete streets projects saw reduced crashes, with many reductions significant. City Health’s 2024 Efficacy of Complete Streets report found total crashes, fatalities and serious injuries reduced for all road users, not only for people walking and biking.
A separate line of evidence reports a 27 percent reduction in serious injury and fatal crashes and a 24 percent drop in bicyclist-involved fatal and serious injury crashes, with an annual reduction in costs on the order of 103 million dollars. Read it as protection working for drivers as well as riders, since the motorist-involved crashes fell too.
The weak point in this literature is corridor selection. Projects are rarely built on random streets, and a high-crash arterial is easier to improve than a quiet residential block, so average before-and-after figures flatter the method. Reports that name the street, the years and the baseline are worth more than large averages from unnamed portfolios, and a city evaluating its own project should be able to produce the same detail.
Which Complete Streets Design Elements Improve Safety?
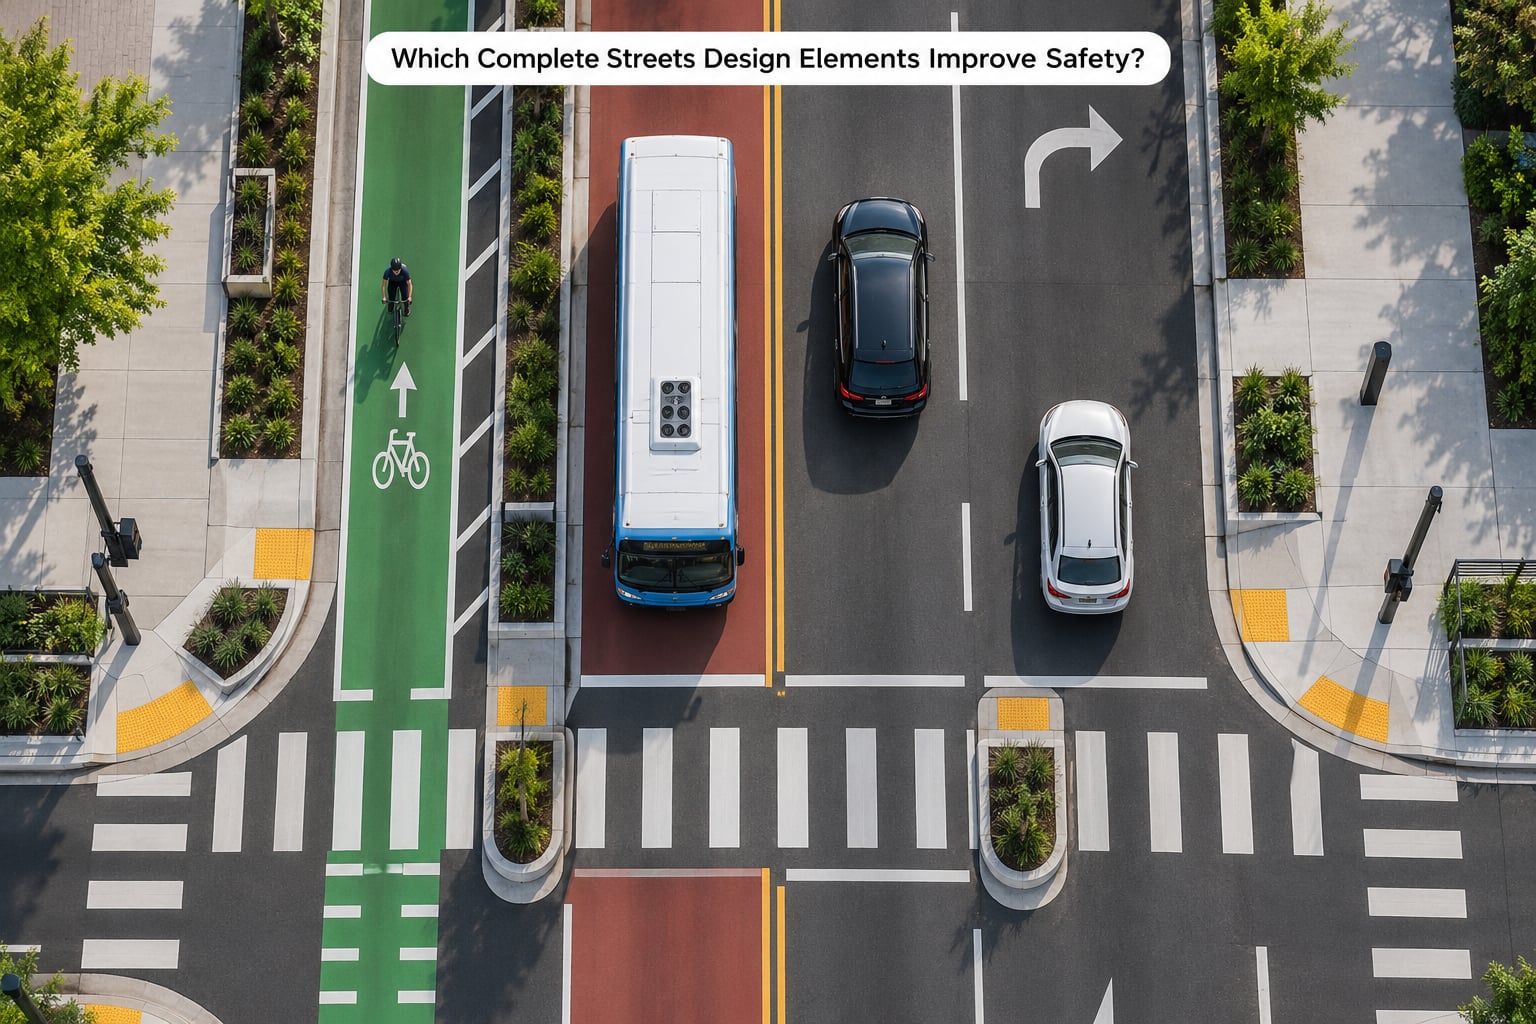
Each element targets one mechanism, and each one fails in a characteristic way when it is dropped or badly built.
Protected bicycle lanes
Separation works best where vehicle speeds are highest and bicycle volumes are meaningful. The caution is transitions: a lane that ends without warning, or a buffer blocked by parked cars at the corner, pushes people back into mixed traffic exactly where the risk is greatest.
Continuous sidewalks and accessible curb ramps
Gaps in the sidewalk network break the trip rather than shorten it. Curb ramps need landing clearance, detectable warnings and cross-slope that meets accessibility standards, or the treatment excludes the people it is meant to help.
Pedestrian refuge islands
A median island lets someone cross a wide street in two stages instead of one, which cuts time spent in the conflict zone. Islands fail when they are too narrow for a mobility device, too short to hold a person out of the turn lane, or paired with a guardrail that blocks sight lines.
Raised crosswalks and raised intersections
Level crossings force turning vehicles to slow and put pedestrians at eye contact with drivers. The caution is drainage and emergency vehicle access, and raised crossings on high-speed arterials with long heavy-vehicle volumes need careful design.
Speed humps, tables and raised crossings
Traffic calming works where people walk and where the speed limit is not already being respected. Two cautions: humps can cut emergency response times on a single route, and they push speed control onto whoever happens to drive through, including trucks.
Curb extensions and tighter corner radii
Small corner radii slow turns, which is the mechanism behind a large share of pedestrian crash reduction. A curb extension sitting in a drainage path or blocking a sight line trades one problem for another, so drainage and daylighting have to be checked at the same time.
Access-point management and daylighting
Consolidating driveways and removing parking near crossings cuts conflicts along a corridor. The caution is functional: a business that loses its only loading space loses freight access, so the consolidation plan needs a delivery and loading alternative.
Transit stop design
Boarding islands and in-lane stops remove the door zone that cyclists and riders otherwise occupy. They work best with enough length to hold a full queue at peak demand; a stop that overflows becomes an obstruction in the travel lane anyway.
Why Geometry Beats Signs and Enforcement
Warning signs and enforcement depend on a driver reading, understanding and complying at every trip. Geometry works whether or not the driver cooperates, because it changes the constraints rather than the request. A 10-foot lane signals room to go fast; a 10-foot lane with a bicycle box painted in it still signals room to go fast.
This is also why partial projects disappoint. A lower speed limit with no physical change to the street leaves drivers in a wide, straight, well-lit corridor that reads as a highway, and measured speeds stay high. Readers who follow the online speed-limit arguments are usually looking at this same pattern.
Why Are Pedestrians, Cyclists, and Transit Riders Especially Important?
People walking, biking or boarding transit are a small share of traffic volume and a large share of those killed. They have no crumple zone, no seat belt and no steel frame, so the same impact energy that leaves a driver sore ends their trip in the emergency department. That gap between exposure and outcome is what makes speed the dominant variable.
Lower speeds help everyone, including drivers. Two mechanisms operate together: the chance of a crash falls because the severity envelope shrinks, and the chance of death or serious injury falls because the impact energy does. Design that lowers speeds also makes the street more forgiving for a driver who runs a red light, a delivery van backing up, or a passenger who steps off a bus into the roadway.
How Do Complete Streets Affect Vehicle Drivers and Traffic?
The honest answer is that outcomes depend on context, and the most common objections come from corridors where the context is genuinely tight.
On traffic volume, road diets and reallocations often move fewer vehicles per lane than the lanes they replaced, but the observed change in corridor volume is usually much smaller than that, because some trips shift, some are absorbed, and some drivers simply change route or time. Where a parallel street is narrow and residential, diversion is real and worth measuring rather than assuming away.
On travel time, removing a lane raises density, and density produces more delay per vehicle than raw capacity suggests. The effect is most visible at peak hours on corridors that were genuinely congested before the change, and much smaller on streets that were underused. Any agency claiming otherwise is overselling.
On capacity and freight, access to loading and servicing has to be designed rather than assumed. Delivery windows, loading bays, turn radii for larger vehicles and emergency routes all constrain what is feasible, and projects that skip that planning generate the complaints that end up quoted as evidence the redesign failed.
On maintenance and navigation, added trees, drainage and paint need budgets and street cleaning cycles, and drivers need advance signage and a corridor they can follow. Most of the argument against redesigns is really about how the transition was handled, not about the end state.
How Complete Streets Design Reduces Crashes at Intersections
Most serious urban crashes happen at intersections, which makes the intersection the place where a complete street delivers its sharpest returns. Six moves do most of the work there.
Curb extensions shorten the crossing by several feet at both ends, which cuts the time a pedestrian spends in the turning path. Tighter corner radii do the same thing for drivers, forcing turn speeds down at the exact point where they matter. Raised crossings put the pedestrian at a level where eye contact is easier and where a vehicle must crawl. Daylighting removes parked cars near the corner so sight lines stay open.
A leading pedestrian interval starts the walk phase a few seconds before vehicles get the green, so the pedestrian is already in the crosswalk when turning drivers begin moving rather than stepping into it. Simplified geometry, removing free-flow turn phases or unnecessary slip lanes, reduces the number of turning movements a driver has to resolve at once.
Each of these works alone. Together they cut both the frequency of turning conflicts and the severity of the ones that remain, which is the combination that shows up in serious-injury counts.
How Can a City Measure Whether Crash Rates Are Falling?
A redesign is a hypothesis. Treat it like one, and evaluate before, during and after with a written baseline.
Start with crash counts and severity. Track total crashes, then the subset that matters most: fatal and serious injury crashes, often called KSI. Severity-weighted measures and rates per vehicle mile or per pedestrian exposure tell a different story from raw totals, and a corridor that crashes less but kills more people is not a success.
Then measure the mechanism itself. Operating speed from posted and 85th percentile speed data is the cleanest proxy, because it moves within months. Crossing distance and turning speed can be measured directly with field observation. For conflicts that never become crashes, video conflict analysis and near-miss counting give you a leading indicator in the first year, before injury data has moved.
Use crash modification factors from the FHWA CMF Clearinghouse to set expectations in advance rather than arguing about them afterward. Formal road safety audits catch design problems before construction, and a before-and-after study on the finished corridor tells you whether the project delivered what the design predicted.
The data itself is increasingly easy to get. State motor vehicle or highway departments publish coded crash files, and many cities publish the same records through open data portals. The work is cleaning location fields to a common geography, mapping crashes to corridor segments, and publishing the result in a form residents can check.
Pair the numbers with what people report: crossing compliance, perceived safety, business foot traffic, transit on-time performance, and accessibility feedback from riders with mobility devices. Quantitative measures lag by years, and qualitative ones tell you early whether the design is doing what you intended.
How Should Cities Plan and Implement a Complete Street?
Eight stages carry most complete street projects from an idea to a measurable result.
Review the data first: crash history by location and severity, speed data, transit reliability, network gaps in sidewalks and bicycle facilities. Then engage the community, including the people who walk the corridor and the businesses that depend on it, early enough that their concerns change the design rather than appear as objections afterwards.
Develop concepts at a level people can argue about, using a street cross-section drawing rather than a rendering. Run a road safety audit and an accessibility review on the preferred option. Where the project can be built quickly with paint, plastic and temporary curbs, pilot it, measure it, and let real behaviour inform the permanent version.
Implement in corridor segments that connect to each other, because isolated pieces do not produce network benefits and riders notice the gaps. Monitor against the baseline on the schedule above, publish the results, and adjust. Every stage has to comply with applicable accessibility and civil-rights standards, including accessible route continuity and construction phase accessibility, and a project that fails those requirements can be rebuilt at significant cost.
What Are the Common Mistakes in Complete Street Projects?
Most projects that fail share a small number of mistakes, and each one has a straightforward correction.
Gaps in a protected network. A lane that stops at a busy intersection is worse than no lane, because it invites a merge into fast traffic. Fix: fund the corridor, not the block.
Inconsistent materials. Cheap paint and flex posts that vanish after a winter read as neglect and invite the wrong behaviour. Fix: match material quality across the whole corridor and budget maintenance.
Unsafe temporary transitions. Most transitional injuries happen during construction, not after it. Fix: design the temporary condition with the same care as the permanent one, including accessible paths and separated cycling.
Inaccessible curb ramps. Ramps that lack landing clearance, detectable warnings or proper cross-slope block the people the project claims to serve. Fix: accessibility review at concept stage and at final inspection.
Excessive design speed. A project that builds a boulevard and then sets a low limit on it produces the mismatch that fuels online complaints. Fix: set the design speed to match the intended operating speed from the start.
Poor drainage. Curb extensions and raised crossings collect water at low points, and standing water on a cycling track gets people into the motor lane. Fix: model drainage before approving the geometry.
Removing parking and loading without a plan. Losing loading access moves freight into travel lanes and turns a safety project into a delay problem. Fix: provide signed loading bays and delivery windows as part of the design.
Choosing sites without baseline data. Without a pre-project count you cannot show an effect, and the first bad year after construction gets blamed for everything. Fix: write the baseline down before anything is built.
Frequently Asked Questions
Do complete streets always reduce traffic crashes?
No, and any agency claiming a guaranteed result is overselling. Reductions depend on corridor context, the severity of the problem before the project, and whether the design is coherent rather than piecemeal. Most well-documented projects show lower serious-injury crashes, while total crash counts can move in either direction because crashes involve multiple road users and some incidents simply shift to parallel streets.
What is the safest speed limit for a complete street?
There is no single number, but design speed has to match posted speed, and the posted limit has to match the land use. A downtown main street with active ground-floor uses and frequent crossings is commonly set at 20 to 25 mph, while an arterial carrying regional traffic may run higher. What matters most is measured operating speed: if drivers are still travelling well above the sign, the geometry is wrong.
Are protected bike lanes safer than painted bike lanes?
Yes. Protection, whether vertical separation, a buffer or a parking barrier, gives a rider a predictable space drivers cannot drift into. Research on protected lanes has found reductions in injury crashes involving both bicyclists and motorists compared with painted lanes on the same corridors. Painted lanes still help with comfort and speed differential, but they depend on drivers leaving a gap at every intersection.
Can complete streets make traffic congestion worse?
Sometimes, and the honest cases are worth naming. Removing a travel lane raises density, and density creates delay that exceeds what raw capacity predicts, most visibly on a corridor that was already congested. Measuring the corridor rather than arguing from photographs matters, because some of the change is route and time shift rather than lost trips. Pilot projects and real travel-time data settle it faster than a public meeting.
How long does it take for a complete street project to show safety results?
Speed and turning-movement changes appear within weeks of opening. Conflict counts and crossing compliance can shift within the first year. Serious-injury crash trends usually need three years before and after to separate the effect from normal year-to-year variation, and fatality changes can take longer. Writing the baseline before construction is what makes those later numbers defensible.
Should every city street be redesigned as a complete street?
No. Every street should be safe for the users it has, but the treatment has to fit the context. Freight corridors, high-speed rural highways and industrial access roads have different demands from residential streets or downtown main streets. The useful framing is that every street should be part of a connected network, with the level of investment matched to the land use and the people actually travelling there.
Conclusion
The causal chain is straightforward: lower operating speed and fewer conflict points mean fewer crashes, protected space and shorter crossings mean fewer exposed conflicts, and refuges, lighting and forgiving geometry mean the crashes that do happen are less severe. Every link is a design decision rather than a request for better behaviour, and every link can be measured.
Start by mapping crash locations alongside pedestrian, bicycle, transit and speed data for the same corridors. The places where serious injuries cluster and the speed profile is highest usually point to themselves, and that overlap is where a city’s first complete street project should go.