
A startup financial model is a spreadsheet that turns your assumptions — pricing, conversion rates, churn, hiring plans and spend — into projected revenue, expenses, burn and cash runway. Building one for a software startup takes an afternoon to start and a disciplined monthly habit to keep useful. Here’s the layer-by-layer process I use, with the formulas written out so you can copy them into your own file.
Skip the generic template hunt. What matters is that the model is driver-based, that every assumption sits on one tab in blue cells, and that you can explain any number in it by pointing at a specific driver.
Table of Contents
- What You Need
- Step-by-Step: How to Build a Financial Model
- Step 1: Define the model’s purpose and time horizon
- Step 2: Map revenue drivers
- Step 3: Build the customer and revenue forecast
- Step 4: Forecast operating expenses
- Step 5: Calculate profit and cash flow
- Step 6: How to Build a Financial Model for a Software Startup Scenario
- Step 7: Review, test, and update the model
- Common Mistakes
- Frequently Asked Questions
- What is the simplest way to start a software startup financial model?
- How many months should a software startup financial model cover?
- Which spreadsheet or tool should I use for a startup financial model?
- How accurate should a startup financial forecast be?
- What is the difference between EBITDA and cash flow in a startup model?
- When should a software startup hire an accountant or financial modelling specialist?
- Conclusion
What You Need
Gather the inputs before you open a blank tab. A model built on invented numbers is just a story with a decimal point in it.
- Actual revenue history. Every invoice or subscription line from the last 12 to 24 months, split into recurring, usage and one-time components.
- Pricing detail. List prices, plan tiers, discount levels, trial lengths and annual versus monthly terms.
- Product and funnel metrics. Visitors, signups, activation rate, trial-to-paid conversion, seats per account, average contract value and logo churn.
- Payroll and hiring plan. Current headcount by function, fully loaded cost per role, and who you intend to hire in which month.
- Operating costs. Cloud and hosting, third-party software, rent, insurance, legal and professional fees, travel and marketing commitments.
- Funding assumptions. Cash on hand today, monthly burn, any signed term sheets or milestone-based tranches, and expected fundraising timing.
- Tax and jurisdiction notes. Where you are registered, which taxes apply to revenue, and when payments land. Rates change, so record the date you looked them up.
- A spreadsheet tool. Excel or Google Sheets both work. Google Sheets is free, collaborative and fine through the seed stage.
Two habits matter more than the tool. Put every assumption in one place, labelled as an input, and mark each forecast line with the month it was last updated against actuals.
Treat every forecast number as an estimate that loses to reality. Each month you have real customer, revenue, expense and cash data, overwrite the assumption rather than defending it.
Step-by-Step: How to Build a Financial Model
The build runs in one direction: assumptions feed the revenue build, the revenue build drives headcount and costs, costs produce profit, and profit converts to cash and runway. Build it in that order and each layer inherits the layer before it.
Step 1: Define the model’s purpose and time horizon
Decide what the model is for before you decide what goes in it. A fundraising model, an operating budget and a hiring plan look similar and behave differently.
- Fundraising. Monthly detail for 24 to 36 months, with the raise, its close date and what it buys.
- Internal planning. Monthly detail for 18 months plus an annual summary for years three and four.
- Pricing decisions. Volume of scenarios rather than one answer, so you can see which deals help.
- Cash management. Weekly or monthly cash positions with committed spend, not just a P&L.
Twenty-four to 36 months is the practical horizon for an early-stage software company. Anything shorter and you cannot show a path to breakeven; anything longer and the assumptions become fiction you have to defend cell by cell.
Keep monthly columns even when the board report is quarterly. Monthly columns let you model hiring start dates and ramp times, and roll up cleanly at year end.
Step 2: Map revenue drivers
Write down every variable that creates revenue before you write any formula. For most software startups that list is short: customers acquired, price per customer, expansion within existing accounts and churned customers.
Then split revenue into the types that behave differently, because they do not share a formula:
- Recurring subscription. Customers times monthly price, with churn applied every month and expansion added on top.
- Usage-based. Units consumed times unit price. Revenue depends on customer behaviour, so drive it from an activity assumption such as API calls or stored gigabytes.
- Services and implementation. Project-based, lumpy, often a one-off that inflates a growth chart and then disappears.
- One-time licences. Cash now, no recurring tail. Model them separately so nobody mistakes them for subscription revenue.
Your go-to-market motion decides which drivers lead. Self-serve is driven by traffic, signup rate and trial conversion. Inbound sales-led is driven by lead volume and close rate. Outbound enterprise is driven by rep capacity, win rate and contract size, with a sales cycle measured in months rather than weeks.
A useful discipline: if a driver cannot be traced back to a number you can observe in your product analytics or CRM, it is a hope, not a driver. Put it in a separate scenario or cut it.
Step 3: Build the customer and revenue forecast
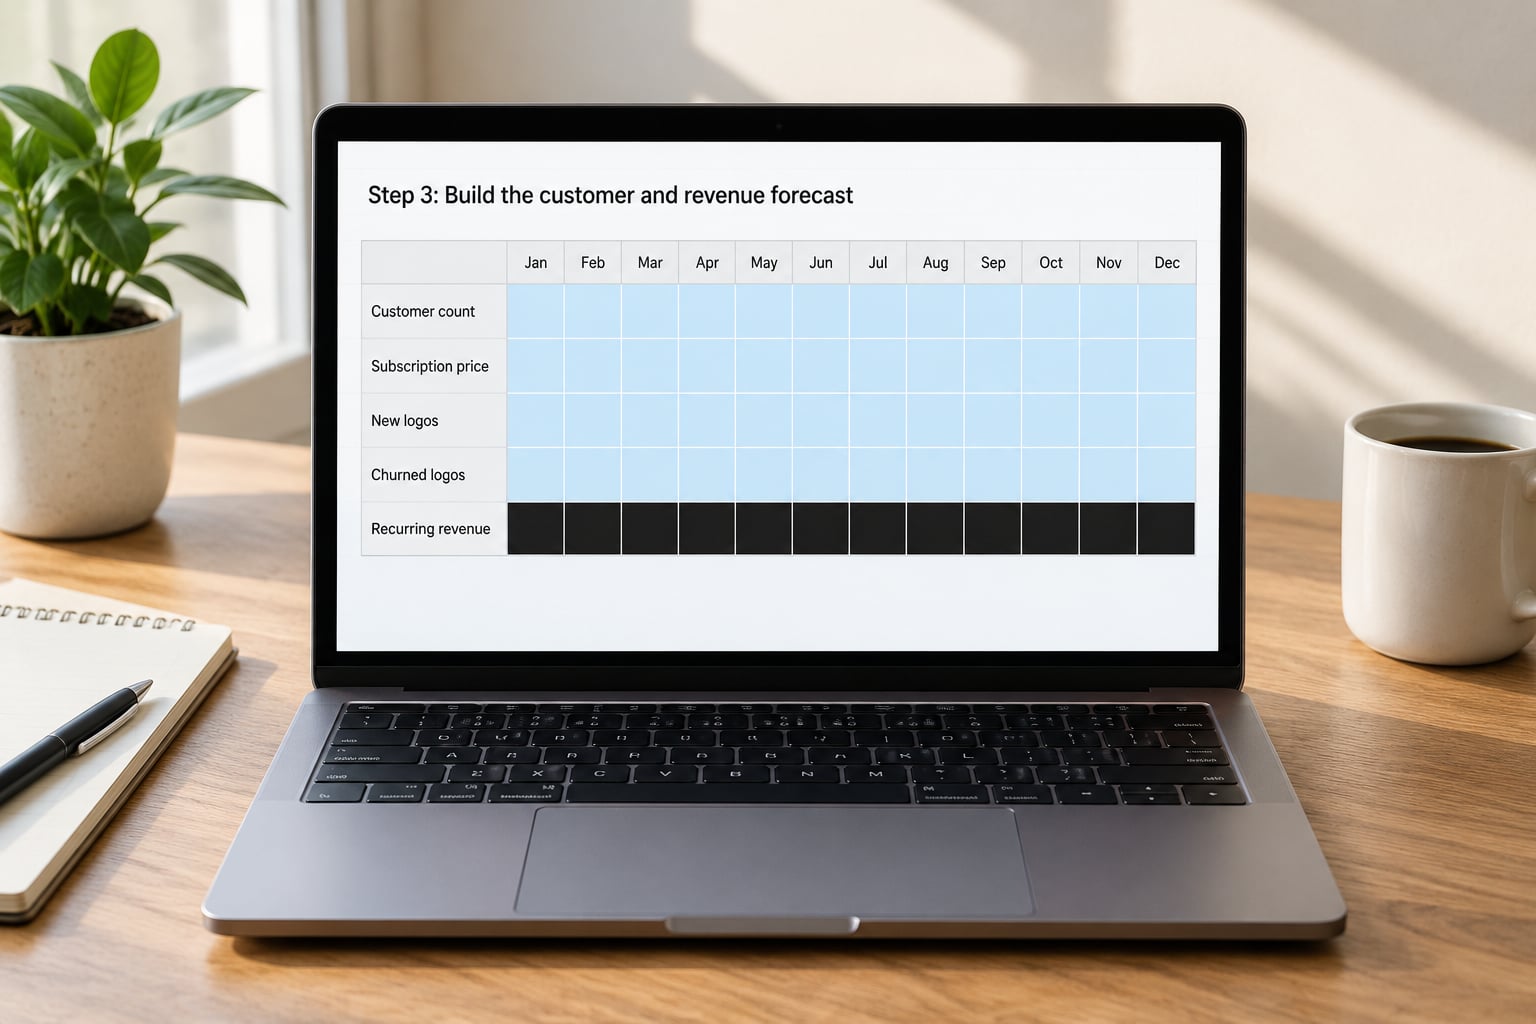
Build a monthly customer roll-forward. Five columns do the work: beginning customers, new customers, churned customers, ending customers and revenue.
Here is the arithmetic in plain English:
- Churned customers = beginning customers × monthly churn rate.
- Ending customers = beginning customers + new customers − churned customers.
- Subscription revenue = ending customers × average revenue per account, per month.
- Expansion revenue = existing revenue × monthly expansion rate, driven by seat growth and upgrades.
- Next month’s beginning = this month’s ending.
For a worked example, take a 14-person B2B software company with 150 customers at an average of 400 USD per month, adding 12 new customers a month and losing 4 percent of logos each month. Month one revenue is 60,000 USD, and the roll-forward carries that forward with new logos and churn subtracted before price is applied.
Run it for twelve months and you land near 878,400 USD of revenue in year one. Notice what the model shows you: churn alone removes roughly six customers a month at 150 accounts, so growth depends entirely on new logos outpacing that. That is the number to argue about, not the revenue total.
Keep new customer adds as an input you can vary monthly rather than a straight-line average. Ramp patterns in real software companies are rarely flat, and a straight line hides the quarter where you actually need cash.
Step 4: Forecast operating expenses
Break costs into lines a founder can actually control, and separate fixed from variable. Fixed costs stay roughly the same month to month, such as rent and insurance. Variable costs scale with revenue, customers or usage, such as hosting, payment fees and support headcount.
- Payroll and benefits. Salary by role, plus employer taxes, benefits and any equity amortisation you want visible.
- Sales and marketing. Split by channel so acquisition cost per channel is measurable rather than blended.
- Software and infrastructure. Third-party tools, cloud and hosting.
- Professional services. Legal, audit, accounting and compliance, usually lumpy and often annual.
- Facilities and travel. Rent, utilities, and travel that follows the sales motion.
- Taxes and overhead. Indirect taxes on revenue, insurance, and everything else that is not payroll.
Set hiring by start month, not by headcount target. A senior engineer who starts in month nine costs nine months less than one who starts in month one, and a model that ignores that quietly inflates expenses. If you are building on revenue triggers, make them formulas: one account executive per fixed amount of new annual recurring value, one support head per fixed number of accounts.
If your product runs on AI models, split cost of goods sold into two lines that behave nothing alike: fixed commitments such as reserved GPU capacity or annual platform contracts, and variable inference cost that rises with each query. Model variable inference cost per active account and let it scale, because that line is usually what breaks the gross margin story.
Continue with our worked example: year-one operating expenses of 1,200,000 USD against 878,400 USD of revenue.
Step 5: Calculate profit and cash flow
Stack the P&L in order: revenue, minus cost of goods sold, gives gross profit. Gross profit minus operating expenses gives EBITDA, which is roughly your operating result before interest, tax, depreciation and amortisation. Net income comes after those items.
Cash is not the same thing as profit, and founders who treat them as one number end up short. The lines that separate them:
- Depreciation and amortisation. Non-cash expenses that reduce profit but not cash in the month.
- Working capital. Annual contracts billed upfront bring in cash before revenue is recognised; monthly billing does the reverse.
- Capital expenditure. Equipment and capitalised software are cash out now, expense over time.
- Taxes. Paid on a lag, often a quarter or more behind the revenue that created them.
- Financing. Loan drawdowns and repayments move cash without touching EBITDA.
Two formulas run the rest of the model. Burn rate = monthly operating expenses − monthly revenue. Runway = cash on hand ÷ net monthly burn.
In the worked example, average net burn is about 26,800 USD a month and cash on hand is 900,000 USD, so base runway is roughly 33 months. Those two numbers are the ones you will be asked about most, so keep them on the first tab.
Label the output as a management forecast built from your own assumptions. It is not financial advice, and it is not a statement about the future. Taxes, payroll obligations and reporting rules vary by country and state, and change over time, so confirm treatment with a qualified accountant before relying on any figure.
Step 6: How to Build a Financial Model for a Software Startup Scenario
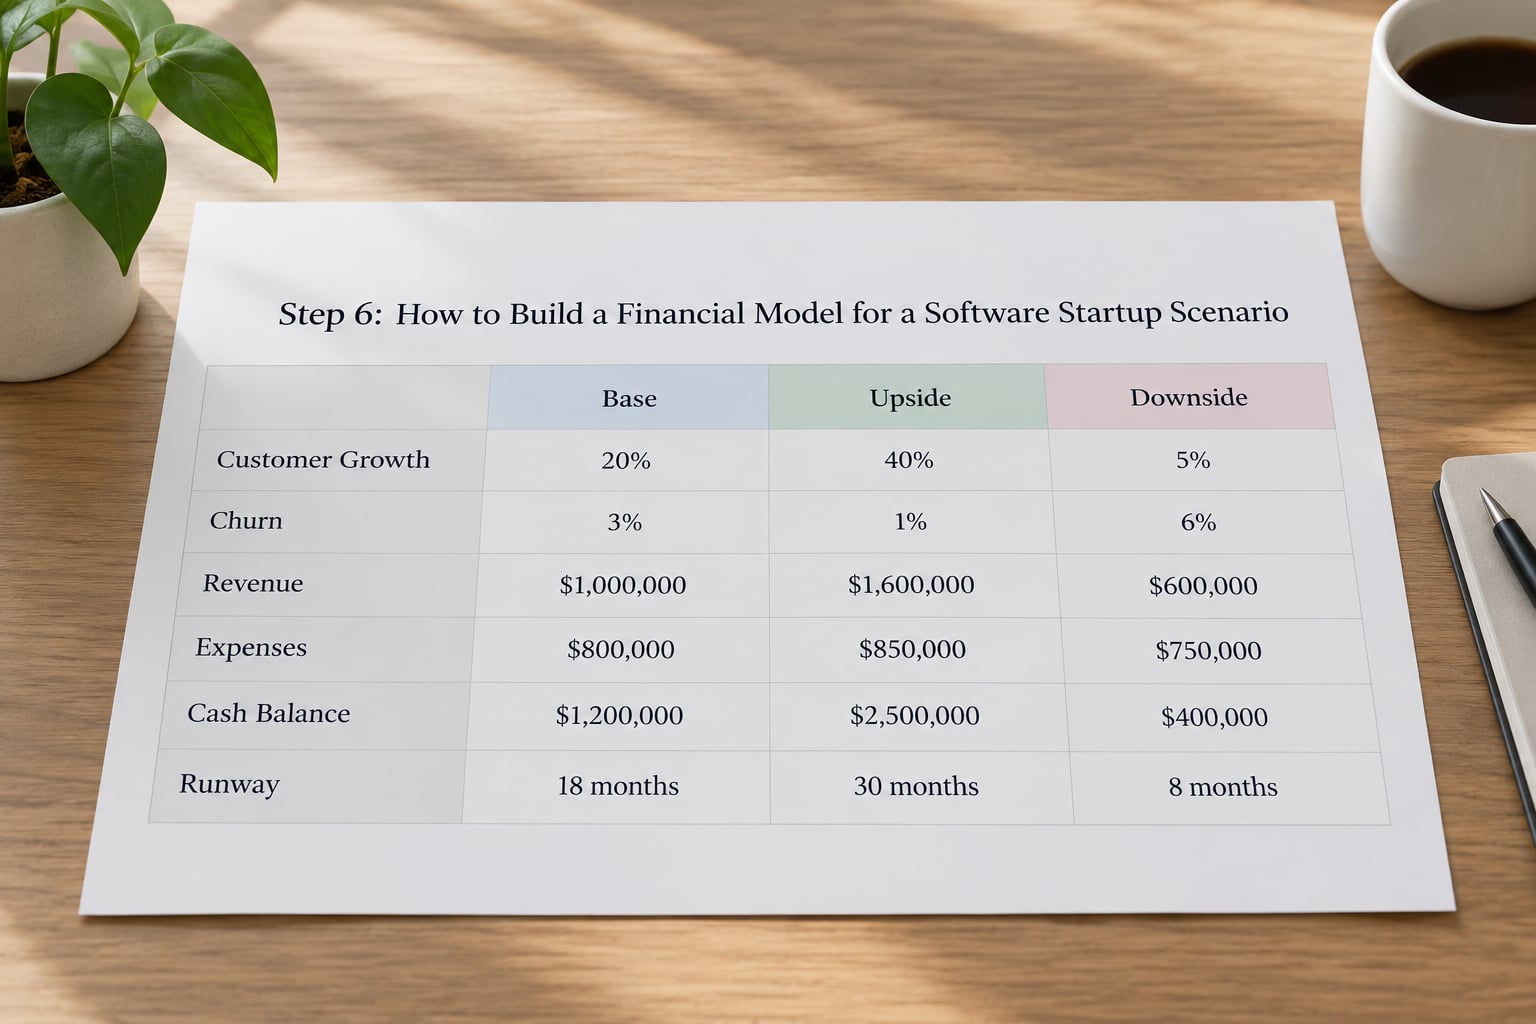
Build three cases by changing a handful of drivers, not by rewriting the model. The cheapest useful version changes five inputs: new customers per month, monthly churn, average revenue per account, sales and marketing spend, and hiring start dates.
- Downside. New logos 30 percent below base, churn 5 percent instead of 4 percent, and no price increase for six months.
- Base. The plan you would defend in a board meeting.
- Upside. New logos 30 percent above base with the same churn, funded by the raise closing two months earlier.
Then compare the three on the metrics that drive decisions: cash balance at month 12, month at which operating expenses are covered by revenue, runway length, and the hiring plan each case supports. In the worked example, the downside case pushes net burn to about 50,000 USD a month and runway down to roughly 18 months from 33.
Attach a trigger to each case so it becomes an action rather than a slide. Examples: if net revenue retention drops below 90 percent for two consecutive quarters, freeze the two planned engineering hires; if cash falls below nine months of runway, start the raise before it drops below six.
Never present the upside case as a promise, and never let the base case quietly absorb the downside assumptions because you want a better-looking chart. Investors push on churn and acquisition assumptions long before they look at the totals, so be ready to say where each number came from.
Step 7: Review, test, and update the model
A model is only as good as its last check. Run a few deliberately boring tests:
- Trace every output. Click a revenue cell and follow it back to inputs. If the chain ends in a hard-coded number, fix it.
- Reconcile. Sum the twelve monthly revenue cells and confirm the total matches the annual column and your invoice total.
- Break the model on purpose. Set churn to zero or price to double and check nothing produces an absurd result.
- Stress the downside. Ask what happens to runway with six months of no new funding and one lost enterprise deal.
- Compare budget to actuals. Every month, put actual revenue, actual headcount and actual spend in adjacent columns and look at the variance.
Give the model an owner and a date. A monthly refresh of revenue, churn, headcount and cash is enough at seed stage; quarterly is fine once you have a finance owner. Keep a short change log recording which assumption moved and why, because that log answers most investor questions about your judgement.
On AI tools: they can draft a starting structure, sanity-check formulas and summarise scenario outputs, and founders on finance forums say they are useful for a first draft. What they cannot do is know your contracts, your tax position or your actual churn, so treat every generated number as an unverified assumption that you must check cell by cell before showing it to anyone.
Common Mistakes
Almost every rejected model comes down to one of these. Each has a straightforward correction.
- Hard-coded values inside formulas. A formula with 400 typed into it cannot be stress-tested. Point it at the assumptions tab.
- Mixing monthly and annual columns. One mislabelled period doubles or halves a number quietly. Label every column header with its unit.
- Treating revenue as cash. Annual prepay, unpaid invoices and payroll tax timing all break that equivalence. Build a separate cash line.
- Ignoring churn and expansion. Net revenue retention is often the difference between a growing and a shrinking company at the same logo count.
- Modelling every cost as a percentage of revenue. Cloud, hosting and support behave like step functions early on. Add them as explicit lines with fixed and variable components.
- Overbuilding the model. Templates that are too complex go stale within weeks. Keep every tab answerable by one question.
- Unrealistic market assumptions. Early adoption follows a learning, traction, scale pattern rather than a straight line, and early-stage sales cycles run long.
- Ignoring hiring timing. Start months, not headcount totals, or your expense forecast is wrong by a full quarter.
- False precision. One decimal place on a customer count you cannot measure makes the whole model look fabricated.
Keep it simple, transparent and decision-oriented. One assumptions tab, one bottom-up revenue build, one headcount plan, one cash view and three scenarios will cover almost everything a software startup needs before Series A.
Frequently Asked Questions
What is the simplest way to start a software startup financial model?
Start with three tabs: Assumptions, Monthly Customers and Revenue, and Monthly Expenses plus Cash. Enter last month’s actual customers, churn and price, then add one row for new customers per month and let ending customers roll forward. That single roll-forward gives you revenue, gross profit and burn. Add headcount and runway once it works, rather than building a full three-statement model on day one.
How many months should a software startup financial model cover?
Twenty-four to 36 months of monthly detail is the practical range for an early-stage software company. It is long enough to show a path toward covering operating expenses and to absorb a fundraising cycle. Add annual summary columns for years three and four so the shape is visible without committing to monthly precision you cannot support.
Which spreadsheet or tool should I use for a startup financial model?
Excel or Google Sheets both work, and Google Sheets is free, collaborative and familiar to most investors. Move to dedicated FP and A software only when several people need to edit the file or when actuals import from your accounting system. The tool matters far less than whether assumptions are visible, formulas are transparent and anyone can follow a number back to a driver.
How accurate should a startup financial forecast be?
Judge the forecast on whether the drivers are reasonable, not on decimal accuracy. Revenue three years out is an estimate of an estimate, and investors know it. What they test is whether churn, acquisition cost and hiring assumptions are consistent with what your product data shows. A model with honest ranges and clear assumptions beats a precise-looking one built on guesses.
What is the difference between EBITDA and cash flow in a startup model?
EBITDA is an operating profitability measure: revenue minus cost of goods sold and operating expenses, before interest, tax, depreciation and amortisation. Cash flow tracks money actually moving, so it also reflects prepayments, receivables, capital expenditure, taxes paid on a lag and financing. A startup can show positive EBITDA while burning cash, and the runway line is built from cash, not EBITDA.
When should a software startup hire an accountant or financial modelling specialist?
Hire an accountant once you have payroll, monthly revenue and real contracts, because bookkeeping, payroll taxes and revenue recognition stop being trivial. Bring in a modelling specialist before a fundraise, when investors will probe your churn and acquisition assumptions. Until then, a clean spreadsheet with an assumptions tab and a downside case covers most pre-seed and seed needs.
Conclusion
Start this week with a 24-month driver-based forecast: one assumptions tab, a monthly customer roll-forward, an expense plan tied to hiring start dates, and a cash line that produces a runway number. Document each assumption and test a downside case before you show it to anyone.
Then overwrite the forecast with actuals every month. A model that only changes when you need a new number is a guess with formatting, while one you update on a fixed day becomes the thing you actually run the company on.