How digital twins help city planning comes down to one thing: testing a change before you build it. A city digital twin pulls maps, sensor feeds, infrastructure records, development applications and forecasts into a single 3D environment, then runs a proposed road, tower, flood defence or bus lane through it so planners can see the consequences in weeks instead of a decade.
This guide covers what an urban digital twin actually is, what it can model, how planners compare options with it, which decisions pay off, what it costs, and how a small or mid-size city can start with one. Written for planners, GIS teams and the civic developers who consume city data.
Table of Contents
- What Is a Digital Twin in City Planning?
- How Digital Twins Help City Planning
- What Can a City Digital Twin Model?
- How Digital Twins Help City Planning Compare Scenarios
- 1. Frame the alternatives as real options
- 2. Define the objective and the measure before you run anything
- 3. Run the same baseline through every option
- 4. Read the outputs for shape, not just score
- 5. Write a decision record
- Which Planning Decisions Can Benefit Most?
- What Data Does a City Digital Twin Need?
- What Is the Step-by-Step Planning Workflow?
- Where digital twins help city planning staff save time
- How Accurate Are City Digital Twins?
- How Much Does a City Digital Twin Cost?
- What Are the Main Benefits and Limitations?
- How Can a City Start with a Digital Twin?
- Frequently Asked Questions
- Do city digital twins replace GIS or traditional city models?
- How is a city digital twin different from a regular simulation?
- Can a small city build a digital twin on a limited budget?
- What role does artificial intelligence play in city digital twins?
- How long does it take to create a digital twin for planning?
- Who owns the data collected through a city digital twin?
- Conclusion
What Is a Digital Twin in City Planning?
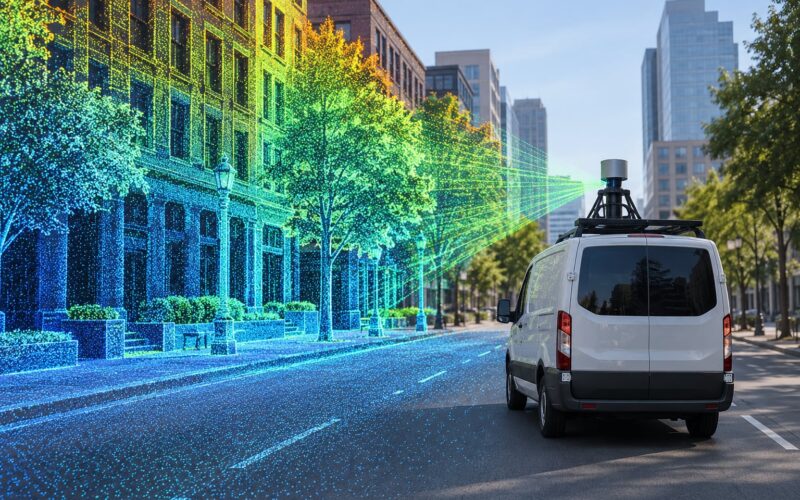
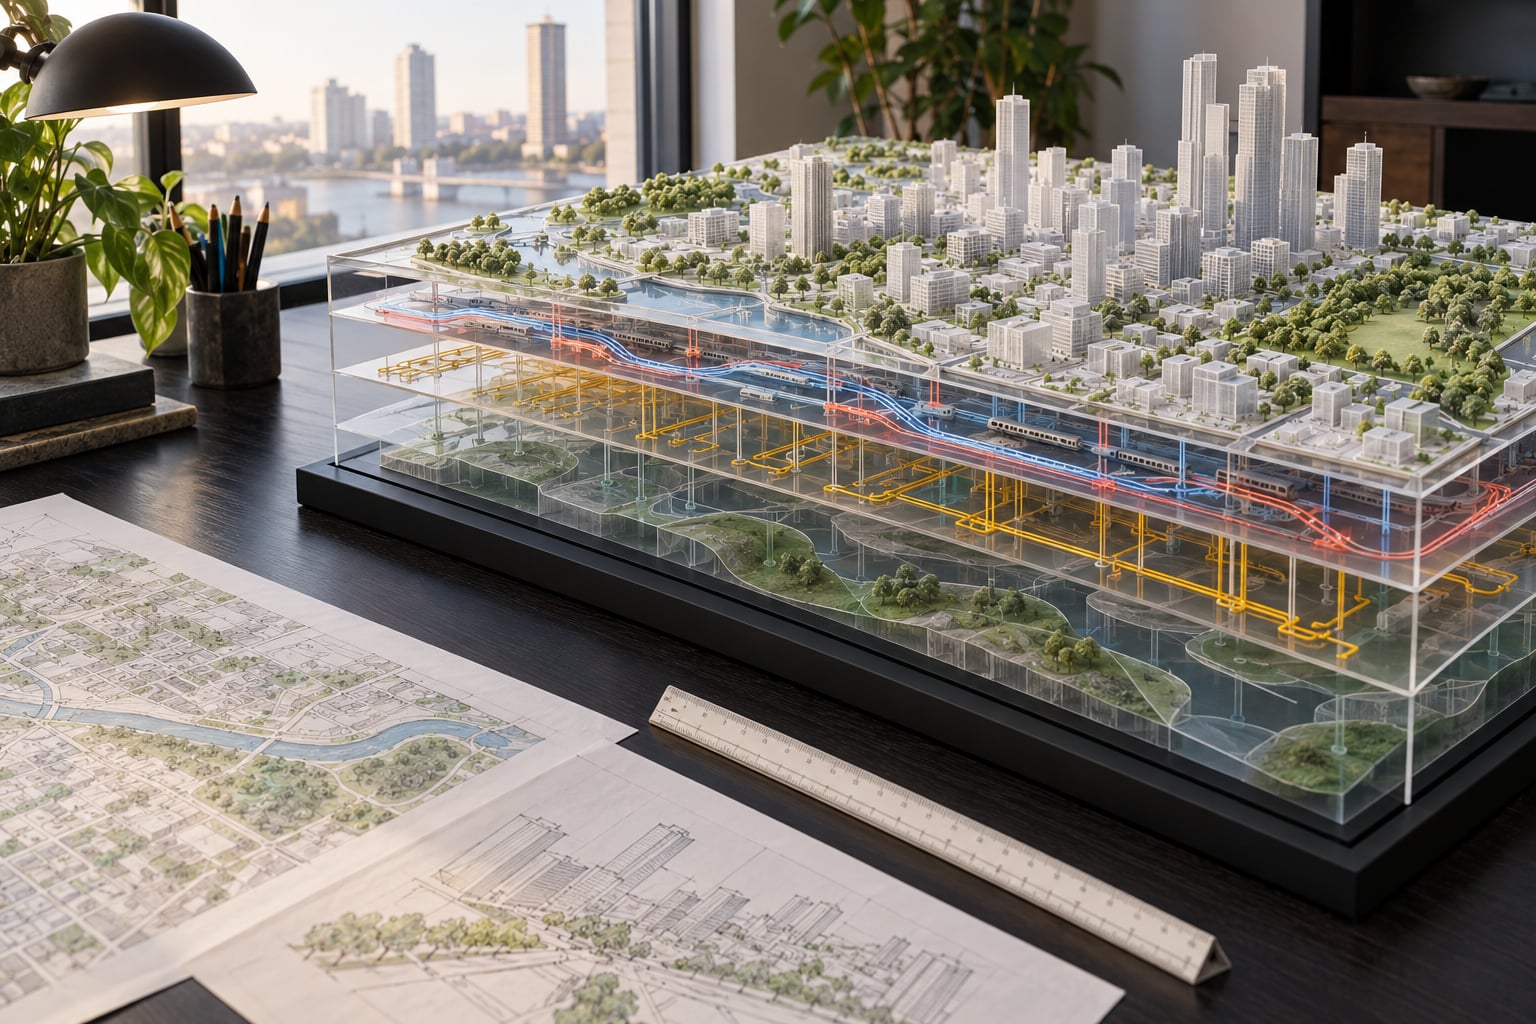
An urban digital twin is a continuously updated, data-driven virtual replica of a city that combines 3D geometry (GIS, LiDAR point clouds, aerial imagery, BIM models) with live sensor, infrastructure and activity data, so planners can simulate a change and see its effects before it is built. A static 3D city model shows you what is there. A twin keeps pace with what is happening and lets you try things.
That distinction is where most confusion in this area comes from, and it is worth stating plainly. A 3D city model is a snapshot: an accurate, beautiful render of the city as it stood on a given date. A one-off simulation is a question answered once, using assumptions a person typed in. A twin is the persistent environment that holds the data connection open, so the same baseline can be re-run, updated and challenged over years.
Tallinn makes the honest version of this visible. Its 3D city model grew from the medieval old town to city-wide coverage and earns its keep for tourism flow analysis and BIM-in-context design review, but city staff have admitted they have no methodological feedback showing how often it changes an actual decision. That is the gap between an impressive twin and a useful one, and it is a technical problem as much as an organisational one.
| Approach | What it is | Connected to live data? | Update cycle | Typical user |
|---|---|---|---|---|
| Static 3D city model | Rendered representation of buildings, terrain and streets at a fixed date | No | Occasional rebuild | Tourism, marketing, visual reference |
| BIM model | Detailed model of one building or site, design intent to as-built | Rarely | Project lifecycle | Architects, engineers, surveyors |
| One-off simulation | Traffic, flood or energy model run for a single question | Usually no | Each study | A consultant, for one project |
| Urban digital twin | Shared environment combining geometry, infrastructure and sensor data with simulation | Yes | Continuous or near real time | Planning, transport, utilities, public |
How Digital Twins Help City Planning
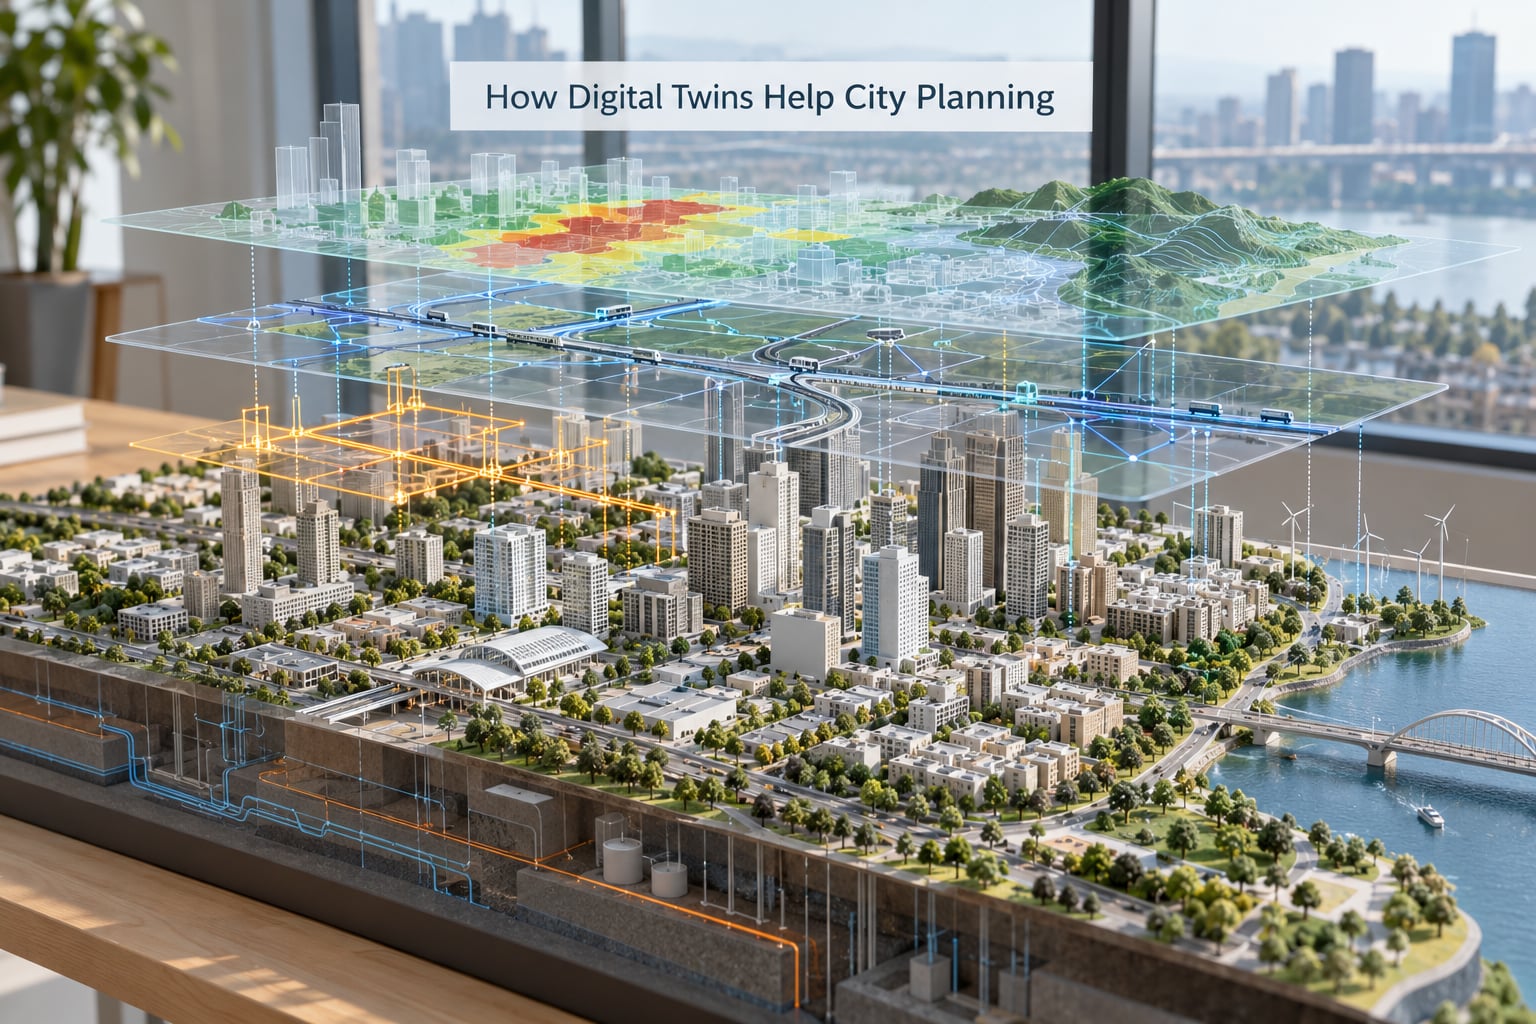
The core answer is testing and comparison. A twin lets a planner run a proposal against real conditions, produce evidence, and adjust before concrete is poured or a vote is taken. In practice that turns into eight concrete uses.
- Testing before you build. A new junction, a transit corridor or a tower cluster can be simulated against existing demand instead of argued from intuition and traffic-count tables.
- Comparing options side by side. Two routing proposals, two housing densities, two flood defence alignments, scored on the same baseline with the same assumptions.
- Showing trade-offs honestly. Travel time against street safety, housing against parking loss, drainage capacity against tree cover. The model makes the cost of a decision visible instead of implicit.
- Coordinating departments. Water, transport, parks and planning teams work from one version of the city rather than four maps that disagree.
- Shortening review cycles. Development applications can be assessed in the existing urban context, including viewsheds, shadow and wind paths, before a hearing date is set.
- Prioritising maintenance. Asset and network models flag where failure is likeliest, so capital programmes are argued from condition data rather than from whichever crew reported last.
- Running growth scenarios. A city expecting a quarter more residents can see where density, water, schools and transit fall short under each population distribution.
- Explaining decisions to residents. A shareable 3D view of a proposal travels better at a public meeting than a technical drawing, and gives people something concrete to argue about.
Practitioners on r/urbanplanning keep returning to the same distinction between useful and impressive. They want evidence of decisions changed, not another dashboard nobody opens.
What Can a City Digital Twin Model?
Most cities do not build one twin. They build several, layered over a common 3D base, each aimed at a different family of planning questions.
| Twin type | What it models | Typical data sources | Planning use |
|---|---|---|---|
| Mobility and transport | Road networks, transit routes, pedestrian flows, intersection delay | Traffic sensors, GPS traces, census journey data, road centre lines | Congestion analysis, transit priority, road diet and junction design |
| Buildings and energy | Building form, envelope, occupancy, energy demand | BIM, LiDAR roof geometry, meter data, retrofit records | Retrofit prioritisation, net-zero roadmaps, building energy benchmarking |
| Land use and development | Parcels, density, growth, daylight, viewsheds | Zoning layers, cadastral data, aerial imagery, development applications | Rezoning, site review, growth scenarios, design review |
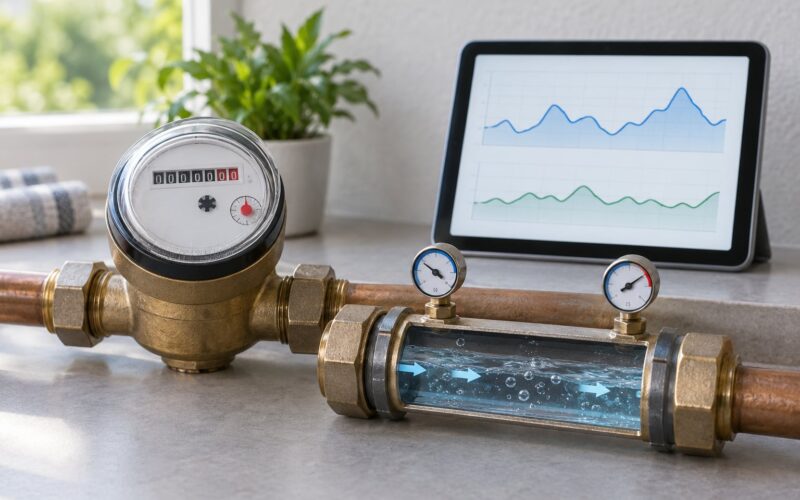
| Utilities and underground | Water, sewer, power, telecom, drainage networks | Utility records, as-built plans, ground penetrating radar, inspection logs | Asset management, excavation coordination, capacity planning |
| Environment and climate | Heat, flood extent, drainage, air quality, canopy | Elevation models, rainfall gauges, satellite imagery, tree inventories | Flood risk, urban heat island response, climate adaptation |
| Emergency response | Access routes, assembly points, evacuation times, service coverage | Network models, incident history, population by block | Evacuation planning, siting fire and ambulance stations |
Seoul’s S-Map is the clearest example of scale. It covers 605.2 square kilometres with roughly 600,000 ground structures plus underground utilities, and seven city committees use it, including the ones handling urban planning and traffic impact assessment. Wind-path analysis there feeds fine-dust and heat-island mitigation, which is exactly the kind of planning question a static model cannot answer.
How Digital Twins Help City Planning Compare Scenarios
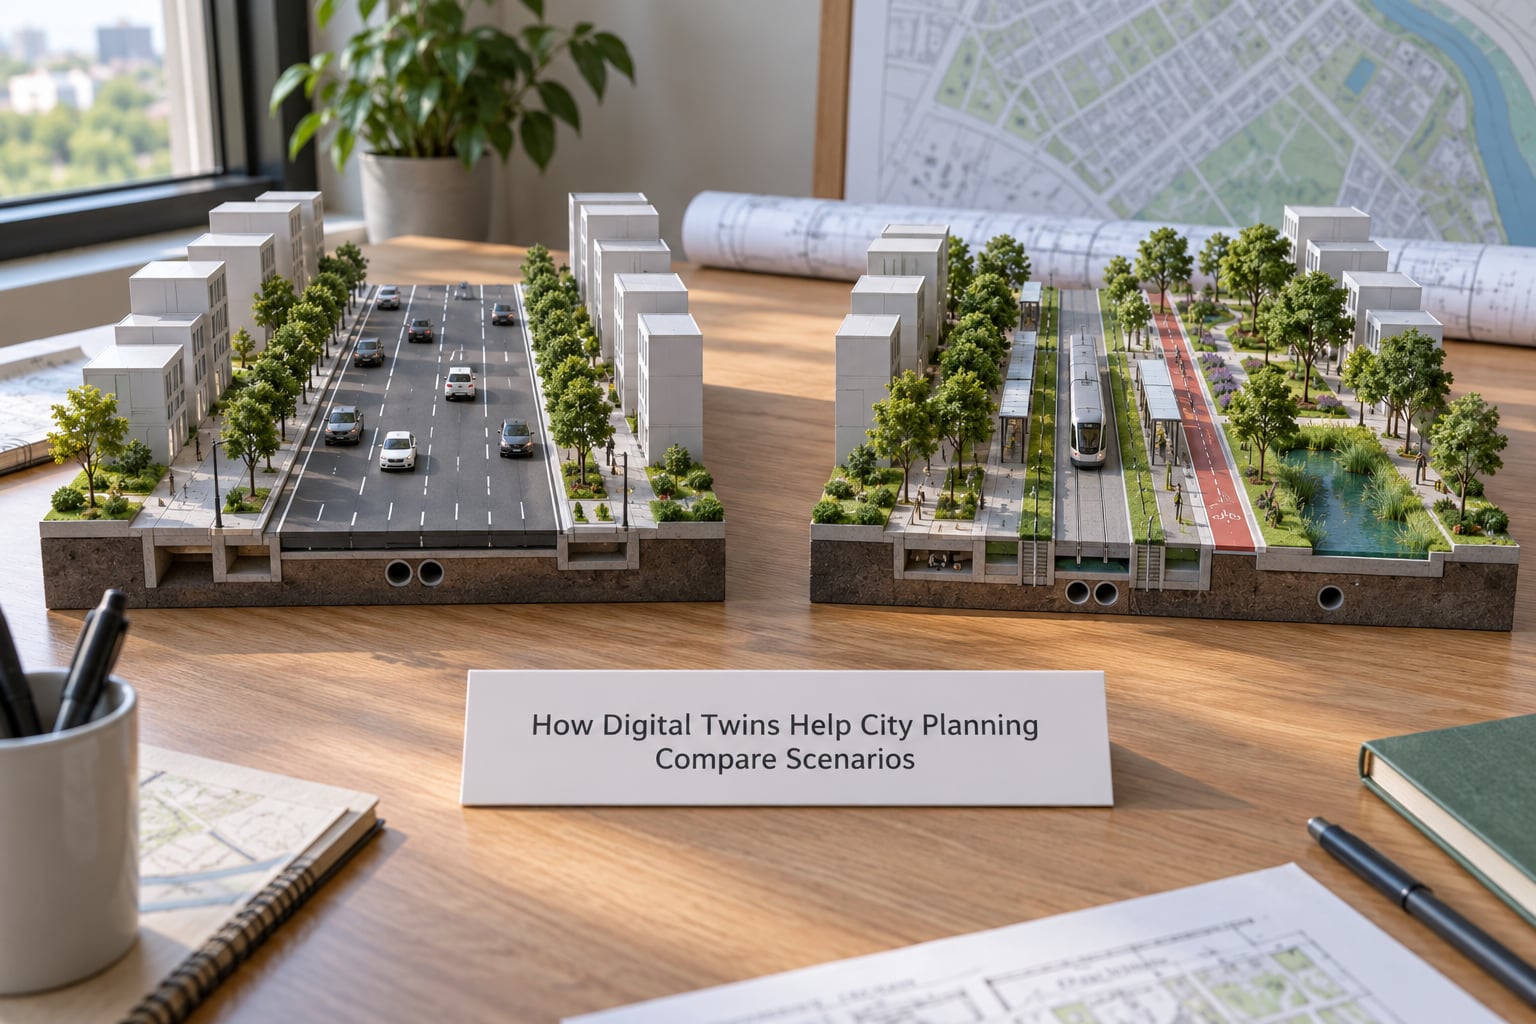
Comparison is the twin’s main job, and it works best when run as a disciplined process rather than a series of impressive demos. Five steps, in order.
1. Frame the alternatives as real options
Three options plus a do-nothing baseline. If the options are not ones the council could actually adopt, the exercise is theatre. Write down what each option changes: kerbs, density, road space, drainage, land take.
2. Define the objective and the measure before you run anything
Pick a small set of indicators: peak junction delay, annual flood volume, hectares of new housing, water demand per capita, tree canopy in target neighbourhoods. Decide the weight of each before the models are run, not after the numbers look disappointing.
3. Run the same baseline through every option
This is where discipline matters. Identical assumptions about population, demand and future development across all variants, or the comparison is worthless. Keep the parameter file with the results so anyone can check what was set.
4. Read the outputs for shape, not just score
Average travel time hides the fact that one option pushes traffic onto three residential streets. Look at distributions, worst-affected blocks and equity patterns. Look at who loses before who gains on average.
5. Write a decision record
One page: the question, the options, the indicators, the assumptions, the result, the dissent. That page is often more useful to a planning committee than the visualisation, and it is what makes the analysis defensible when the decision is challenged months later.
Which Planning Decisions Can Benefit Most?
The strongest results cluster around decisions that are expensive, hard to reverse and contested. Zoning and land-use policy testing sits at the top: a twin lets a council show residents what a density change does to sunlight, traffic and local services before the policy is written.
Transport decisions follow closely. Route choice, bus priority and multimodal network planning all benefit from a baseline that reflects real observed flows rather than a model built for one corridor.
Public space and design review is where smaller cities get the most visible wins. Des Moines used its twin to test the viewshed impact of proposed buildings on the Iowa State Capitol dome before anything was built, and parks staff used shade-cover analysis to site a community garden. Those are small decisions with immediate political consequences, and they are cheap to model well.
Climate adaptation is where the numbers justify the effort. Flood extent, drainage capacity, heat exposure and tree canopy can be mapped against proposed development, so adaptation spending is aimed at blocks that need it rather than distributed evenly for political comfort.
Infrastructure maintenance and emergency planning round it out. Knowing which water main has the highest failure likelihood, or how long it takes to move people out of a district with a blocked bridge, is information that changes where money goes.
| City | Programme or model | What it models | Primary planning use |
|---|---|---|---|
| Singapore | Virtual Singapore | National 3D city model with live data feeds | Cross-agency planning and simulation |
| Seoul | S-Map / Virtual Seoul | 605.2 km², about 600,000 structures plus utilities | Committee review, traffic impact, wind and dust studies |
| Helsinki | 3D city model | Building-scale city model with open interfaces | Urban planning, climate and energy analysis |
| Tallinn | 3D city model and GreenTwins | City-wide 3D model, twin building energy models | Tourism flow analysis, BIM-in-context review |
| Des Moines | City digital twin | Downtown 3D twin, expanded since 2019 | Viewshed protection, park shade analysis |
| Sioux Falls | 3D mesh base map | City-wide mesh with underground utility features | Preparing for projected 25% population growth |
What Data Does a City Digital Twin Need?
Data capture and maintenance, not rendering, is what stalls most twin programmes. Practitioners say it plainly: keeping a high-fidelity representation current is the real blocker, and no amount of 3D polish fixes a stale record.
- Geospatial base. Cadastral parcels, road centrelines, terrain and elevation models, and a classified point cloud from LiDAR or photogrammetry. This is the floor everything else sits on.
- Building data. Footprints and heights at minimum, BIM models where they exist, construction year, use and storey count for anything you want to model energy or daylight on.
- Infrastructure and underground records. Water, sewer, power, telecom and drainage. Often the least accurate and most valuable layer, and the one most likely to sit in an inaccessible format.
- Environmental. Rainfall and drainage, air quality stations, temperature loggers, tree canopy and land cover, satellite imagery for change detection.
- Mobility. Traffic counts, sensor or camera feeds, journey pattern data, transit schedules and ridership.
- Population and activity. Census and register data at small-area resolution, plus development applications and planning policy layers.
- Operational feeds. Work orders, inspection results, outage logs. These are what turn a model into a twin.
Four properties decide how reliable the result is. Quality tells you whether a layer can carry weight in a decision. Frequency decides whether it is a snapshot or a twin. Ownership decides whether you can keep updating it after the contract ends. Interoperability decides whether departments can combine layers at all, and open formats matter more here than any product brand.
What Is the Step-by-Step Planning Workflow?
A working twin fits into an existing planning cycle rather than running beside it. The steps, roughly in the order a study needs them:
- Define the planning question. One sentence, one decision, one deadline. If it takes a paragraph, the scope is wrong.
- Set the model boundary. A corridor, a catchment, a redevelopment district. Small boundaries validate quickly and keep costs proportionate.
- Collect and audit the data. Inventory what exists, rate each layer for quality and freshness, and write down what you will not be able to model.
- Build and validate the baseline. Calibrate the model against observed counts, flows and known events. An unvalidated baseline is an opinion with a 3D interface.
- Run the scenarios. Alternatives plus baseline, identical assumptions, recorded parameter files.
- Consult stakeholders. Share the model early. Departments and residents surface constraints no simulation encoded.
- Use the findings in the real process. Report to committee with the decision record attached, and track what happened next.
Where digital twins help city planning staff save time
The saving is not in producing prettier plans. It is in avoiding rework: re-run a transport model once when the corridor option changes, instead of commissioning a new study; answer a resident question about shading or flooding at the counter from the model instead of scheduling a site visit; and shorten the discovery phase of a development review. Teams that describe a genuine time saving point to that repetition, not to the visualisation.
How Accurate Are City Digital Twins?
Accuracy is not a property of the twin. It is a property of the question asked of it, so the honest answer is: accurate enough for the decision, and no more. A model tuned to peak-hour traffic is not automatically fit for assessing a 20-year drainage scenario.
Planners should judge fitness for purpose with a few ordinary checks:
- Calibration error. Does the model reproduce observed flows, counts or flood extent within a stated tolerance on a set of dates nobody tuned it against?
- Data freshness. What is the age of each input layer, and which conclusions depend on the stalest one?
- Sensitivity testing. Change the key assumptions and see whether the ranking of options flips. If it does, the result is not decision-grade yet.
- Independent review. Someone who did not build the model should be able to reproduce a result from the stored parameters.
Be sceptical of any figure presented without a method. Percentages quoted as digital twin benefits in vendor material frequently come from one pilot in one city, and the honest ones say so. The more useful question to ask a supplier is which named decisions changed, because that is a much harder claim to support.
How Much Does a City Digital Twin Cost?
There is no single defensible figure, because the cost is dominated by scope and by how much data already exists in usable form. What does drive the bill:
- Data preparation and capture. Cleaning inconsistent records, correcting geometry, aerial or LiDAR capture where coverage is missing. Usually the largest and most underestimated line.
- Software and computing. Platform licences, storage for imagery and point clouds, and the simulation engines themselves, which are often separately licensed.
- Modelling expertise. Transport, hydraulic and energy modellers are scarce and are hired against construction and engineering timetables.
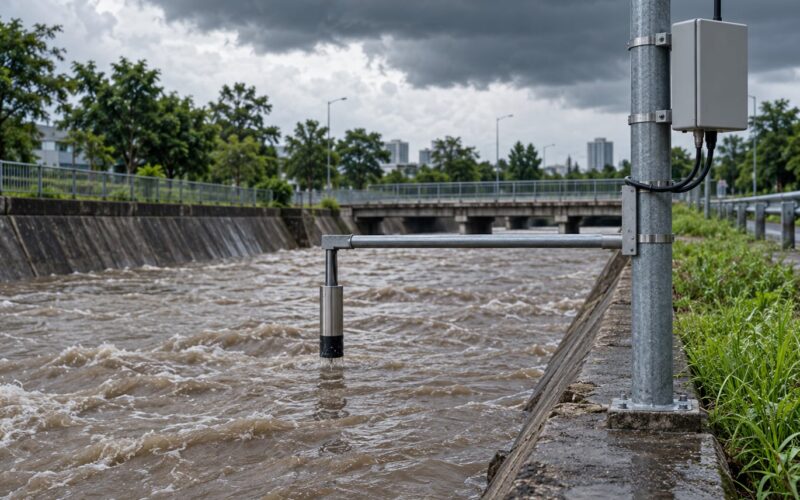
- Sensors. Traffic, water level and air quality networks, plus installation, power and communications, and years of maintenance.
- Integration. Connecting the twin to GIS, asset management, work order and finance systems. Unglamorous and frequently underestimated.
- Maintenance and governance. Someone has to own refresh cycles, data quality rules and model version control after the launch team disbands.
Two cost realities worth holding onto. The recurring cost is the larger one: a twin nobody updates becomes a misleading snapshot. And a contract that leaves the model in a vendor’s proprietary format is a rental, not an asset, which shows up as an exit cost later.
What Are the Main Benefits and Limitations?
The benefits are real but conditional, and the conditions are usually organisational rather than technical.
On the positive side: faster scenario testing, fewer expensive mistakes, evidence that survives a public hearing, a shared picture across departments, and a far better explanation of a proposal to people who will never read a technical report. Named twins such as Virtual Singapore and Helsinki’s 3D city model have become standard references precisely because they are shared infrastructure rather than one team’s project.
On the other side, the limitations are worth stating plainly.
- Cost and slow progress. Cities routinely sign up to huge upfront investments they cannot justify, and then report progress too slowly to sustain political attention.
- Data staleness. Models drift from reality within months without a refresh routine, and a confidently wrong twin is worse than a simple map.
- Organisational adoption. Des Moines staff identified cross-department uptake, not the technology, as the binding constraint. Staff habits and political turnover both slow this down.
- Vendor lock-in. Proprietary formats and platforms a city cannot maintain or hand over turn a public asset into a dependency.
- Privacy and surveillance. Fine-grained mobility data and accurate street-level 3D can support analysis that residents reasonably object to. Publish aggregation rules, retention periods and a stated purpose for every dataset collected.
- False certainty. A simulation is a scenario under assumptions. Presenting one as a forecast is the fastest way to lose the council’s trust when reality diverges.
There are cases where a digital twin is the wrong investment: no upcoming decision it would inform, no data owner who will keep it current, no staff time to maintain it, or a question answerable with a simpler transport model or a good spreadsheet. Saying so early is a sign of a serious programme.
How Can a City Start with a Digital Twin?
A focused pilot tied to a real decision is the only version of this that works for a small or mid-size city.
- Pick one question with a deadline. Something already in the work programme, ideally within twelve months.
- Draw a small boundary. A corridor, a catchment or a redevelopment site. Resist the urge to model the whole city.
- Reuse data you already own. Start with existing GIS, utility records and imagery. Buy new capture only where a missing layer blocks the question.
- Set success criteria up front. A validated baseline, one decision changed, one committee paper using the model. If none of that happens, the pilot failed regardless of how good the render looks.
- Plan the handover. Agree open formats, ownership and the refresh routine in the contract, before anything is built.
For civic app developers and open-data communities, the interesting angle is the same data from the other direction. Cities that publish twin layers through open APIs give outside teams the raw material for transit apps, heat exposure maps and accessibility tools, and the pressure to keep those layers documented and machine-readable is often what stops them decaying. If you build on city data, ask for the schema and the update schedule, not just a download.
Frequently Asked Questions
Do city digital twins replace GIS or traditional city models?
No. A twin sits on top of them. Your GIS remains the authoritative record of parcels, streets and assets; the twin is the working environment where geometry is combined with live data and simulation runs. What the twin often replaces is the ad hoc deck of static renders assembled for each council meeting.
How is a city digital twin different from a regular simulation?
A simulation answers one question, once, using assumptions a person typed in. A twin stays connected to the city’s data, so you can ask many questions against one baseline and see how the baseline itself has moved. The practical test: if the model must be rebuilt and revalidated before each study, it is a simulation, not a twin.
Can a small city build a digital twin on a limited budget?
Yes, with a narrower scope. A city of forty thousand people does not need a metropolitan twin; it needs one corridor, one flood-prone catchment or one redevelopment district modelled properly. The trick is choosing a boundary you can validate using data you already own, and writing handover terms into the contract from day one.
What role does artificial intelligence play in city digital twins?
Mostly pattern work: classifying point clouds into roof, tree and surface types, flagging anomalies in sensor feeds, filling gaps in incomplete records and running many scenario variants quickly. Simulation still does the physics. AI can produce confident answers from poor inputs, so treat model output as evidence to check rather than a finding to announce.
How long does it take to create a digital twin for planning?
Longer than a demonstration suggests, because the delay is data work rather than rendering. A focused pilot tied to one planning question can reach decision-ready in roughly six to twelve months with existing staff and data. A city-wide twin covering buildings, utilities and live sensor feeds is a multi-year programme, and the maintenance never ends.
Who owns the data collected through a city digital twin?
Usually the city, but the picture is messy. Sensor and operational data may sit with contractors or utilities, and derived models are often owned by the platform vendor. Settle ownership, handover and open-format terms before delivery. If a city cannot export its own model when a contract ends, it has rented a twin rather than built one.
Conclusion
The answer to how digital twins help city planning is not better pictures. It is the ability to test a consequential decision against real conditions, show the trade-offs, and keep a defensible record of why the choice was made. That works when the data is honest about its age, the assumptions are written down, and someone owns the model after launch.
Start with one question that already has a deadline on the planning calendar, the smallest boundary that answers it, and the data you already have. Agree the validation criteria and the handover terms before anything is built. Six months later you will have either a decision that changed or a clear reason not to keep going, and both outcomes are worth having.