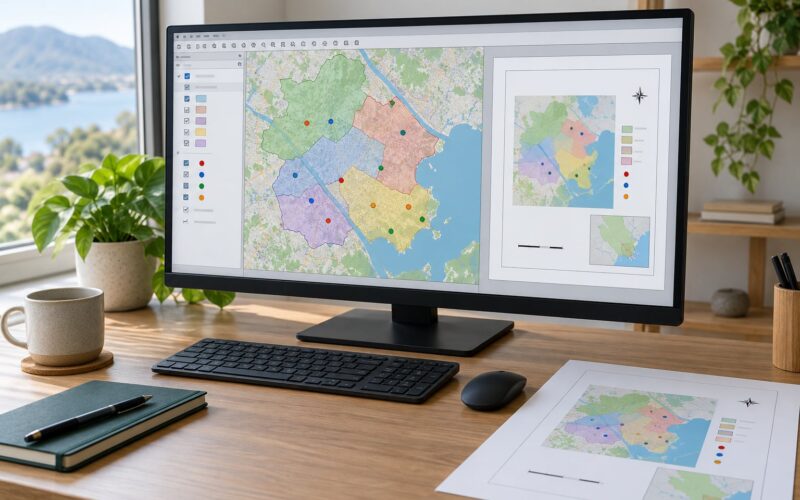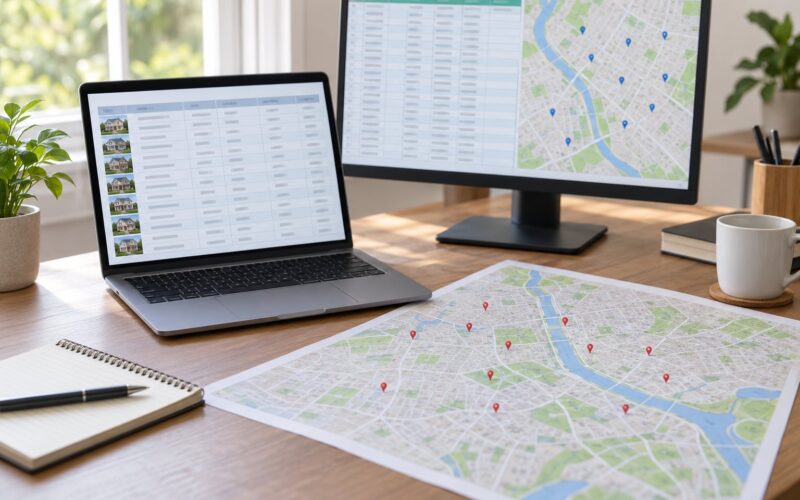
GeoJSON is an open, JSON-based format for representing geographic features — points, lines, and polygons — along with the attributes that describe them. It was standardised as RFC 7946 by the IETF in August 2016, and almost every web mapping library can render it directly.
The practical reason developers reach for it is simple: a GeoJSON file is plain text. You can open it in a text editor, read it, diff it in Git, hand-edit one coordinate, and send it to a colleague as an email attachment. Nothing needs installing to view it.
Every tool mentioned below still runs as described in 2026 — the format has been stable since RFC 7946 was published, so what you read here works in a browser or a terminal today.
Table of Contents
- What GeoJSON Is and How to Use It in Civic Apps
- What Is GeoJSON?
- The Six GeoJSON Geometry Types
- How Is GeoJSON Structured?
- What GeoJSON Is and How to Use It in JavaScript
- How to Load GeoJSON on an Interactive Web Map
- How to Validate and Troubleshoot GeoJSON
- Where Can You Find and Use GeoJSON?
- GeoJSON vs. Shapefile, GeoPackage, and Mapbox Vector Tiles
- Frequently Asked Questions
- Is GeoJSON still used?
- Can GeoJSON contain elevation or time data?
- Why is my GeoJSON map showing in the wrong location?
- Can I edit GeoJSON in QGIS?
- Should I use GeoJSON or GeoPackage?
- Is a GeoJSON file the same as Google Maps data?
- Conclusion
What GeoJSON Is and How to Use It in Civic Apps
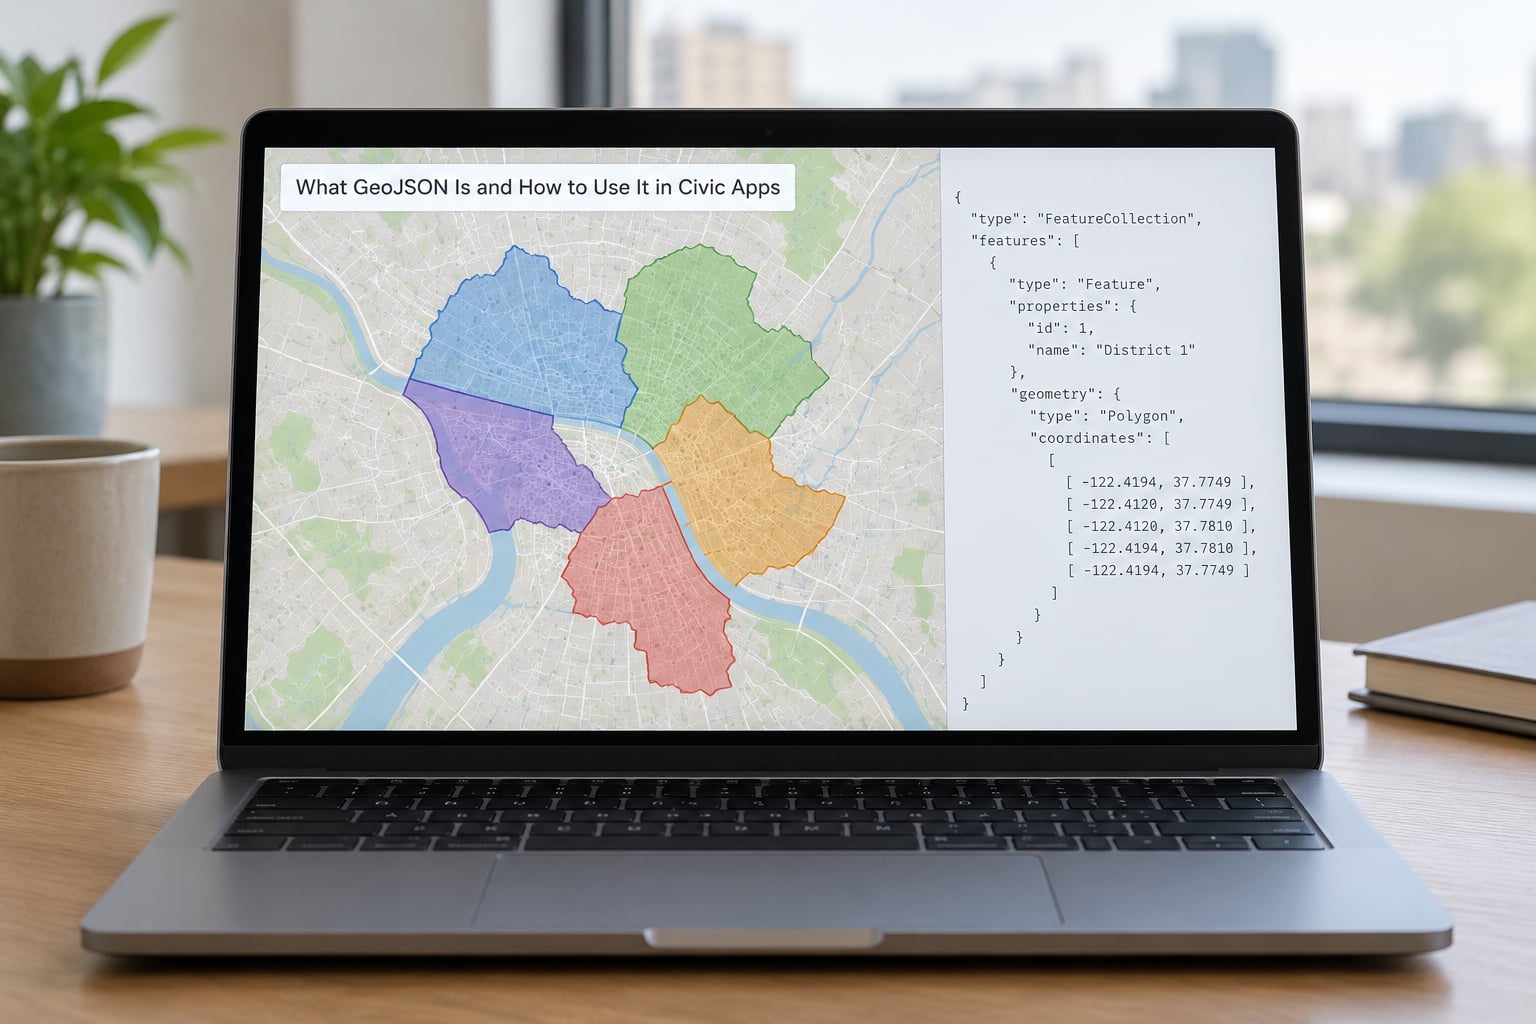
For civic and open-data work, GeoJSON is the format that gets a city’s shapes onto a map with the least friction. City council district boundaries, transit route alignments, bike-share station locations, park entrances, air-quality sensor feeds, building footprints, pothole reports from residents — all of them are naturally expressible as GeoJSON.
Most cities already publish this data in GeoJSON or in a source format that converts to it in one command. The format is the common language between a data portal, a city back office, and a browser map that anyone can build.
Where it fits less well: files in the tens of megabytes, datasets that change hourly, and anything that needs a spatial index or enforced attribute schema. Those cases want vector tiles, GeoPackage, or a database with a geometry column, and I’ll cover the decision rule further down.
What Is GeoJSON?
GeoJSON started as a working group project in 2007, went through a couple of informal drafts, and was finally published by the IETF as RFC 7946 in August 2016. That matters for one practical reason: the current spec removed the older crs member, so a valid modern file has no coordinate reference system field at all. Everything is assumed to be WGS 84 in decimal degrees.
It is a subset of JSON, not a separate language. A GeoJSON file is a JSON document that follows certain naming and nesting rules, which means every JSON parser on earth can read it. Python’s standard json module, JSON.parse in a browser, jq in a shell — all of them work without a special library.
It is also not a tile service. A map tile service like a raster XYZ endpoint returns square images of the world at fixed zoom levels. GeoJSON returns the actual coordinate data, so the client decides how to draw it. That distinction matters when you’re deciding what to build: tiles for a basemap, GeoJSON for the layer of interest on top.
The relationship to OpenStreetMap is about the data model, not the format. OSM’s native storage is a database of nodes, ways, and relations. Convert that data to GeoJSON and you get points for nodes, LineStrings for ways, and MultiPolygons for closed ways tagged as areas — the same feature types you would build by hand for a city dataset.
The Six GeoJSON Geometry Types
There are seven geometry types in the spec, but six of them are used constantly and one is rare. Here is what each one is for, with the coordinate structure you actually write.
| Type | Coordinates structure | Civic data example | Coordinate notes |
|---|---|---|---|
| Point | One position: [lon, lat] | A bike-share docking station | A single position, not nested in an array |
| MultiPoint | Array of positions | Every sensor in one air-quality district | Two levels of brackets, not three |
| LineString | Array of two or more positions | One bus route between two stops | Order of positions defines direction of travel |
| MultiLineString | Array of coordinate arrays | All routes in a transit network | Each inner array is a separate, unconnected line |
| Polygon | Array of linear rings | The outline of one city park | First and last position must be identical |
| MultiPolygon | Array of polygon coordinate arrays | All parks in a city, or all council districts | Each polygon gets its own ring array, first ring is the outer boundary |
The nesting depth is where people trip. A Point has one pair of coordinates. A LineString has an array of them. A Polygon has an array of those arrays. MultiPolygon adds one more level. Get the depth wrong and the file parses as valid JSON but no library can read the geometry.
Polygons also carry two rules that quietly cause failures. Every ring must be closed, meaning the last position repeats the first. And the spec recommends that the outer ring wind counterclockwise, with holes wound clockwise — some renderers tolerate a violation, others produce a filled hole where the park should be.
The seventh type, GeometryCollection, holds an array of mixed geometry objects under its own geometries key instead of coordinates. It is legal and occasionally useful, but plenty of tools handle it badly. Splitting it into separate features is usually the safer move.
How Is GeoJSON Structured?
A valid GeoJSON document is one of three things: a FeatureCollection, a single Feature, or a bare geometry object. In practice you will meet FeatureCollections almost every time, because that is the shape a file needs to hold more than one thing.
{
  "type": "FeatureCollection",
  "features": [
    {
      "type": "Feature",
      "geometry": { "type": "Point", "coordinates": [-77.0366, 38.8977] },
      "properties": { "name": "Metro Center", "lines": "Red, Blue, Silver", "accessible": true }
    },
    {
      "type": "Feature",
      "geometry": {
        "type": "LineString",
        "coordinates": [[-77.0366, 38.8977], [-77.0091, 38.8898]]
      },
      "properties": { "name": "Route 7", "type": "bus" }
    },
    {
      "type": "Feature",
      "geometry": {
        "type": "Polygon",
        "coordinates": [[[-77.0502, 38.8898], [-77.0091, 38.8898], [-77.0091, 38.9051], [-77.0502, 38.9051], [-77.0502, 38.8898]]]
      },
      "properties": { "name": "Downtown Historic District", "district_id": "HD-01" }
    }
  ]
}
Walking through it from the outside in: the top-level type is FeatureCollection and its features array holds every feature. Each feature has its own type, a geometry object, and a properties object.
Properties are freeform. There is no schema, which is convenient until three different teams publish district boundaries using three different property names. Decide on your own names early and document them, because nothing else will enforce it for you.
What GeoJSON Is and How to Use It in JavaScript
Reading GeoJSON in JavaScript needs no library — JSON.parse handles it because it is JSON. The Fetch API loads a local or remote file, and the interesting work is in the properties you pull out afterwards.
const response = await fetch('data/districts.geojson');
const districts = await response.json();

console.log(districts.features.length);

for (const f of districts.features) {
  console.log(f.properties.district_id, f.geometry.type);
}
That loop is the pattern for most civic map work: iterate features, read properties for labels and attributes, use geometry.coordinates for position or bounds. If you need real spatial work — distances, intersections, point-in-polygon — reach for Turf.js rather than writing the maths yourself.
One gotcha worth naming: a downloaded file you open in Chrome or Edge is a local file:// URL, and fetching it from a page will be blocked by the browser’s security rules. Serve the folder with a local server instead, and the fetch works normally.
How to Load GeoJSON on an Interactive Web Map
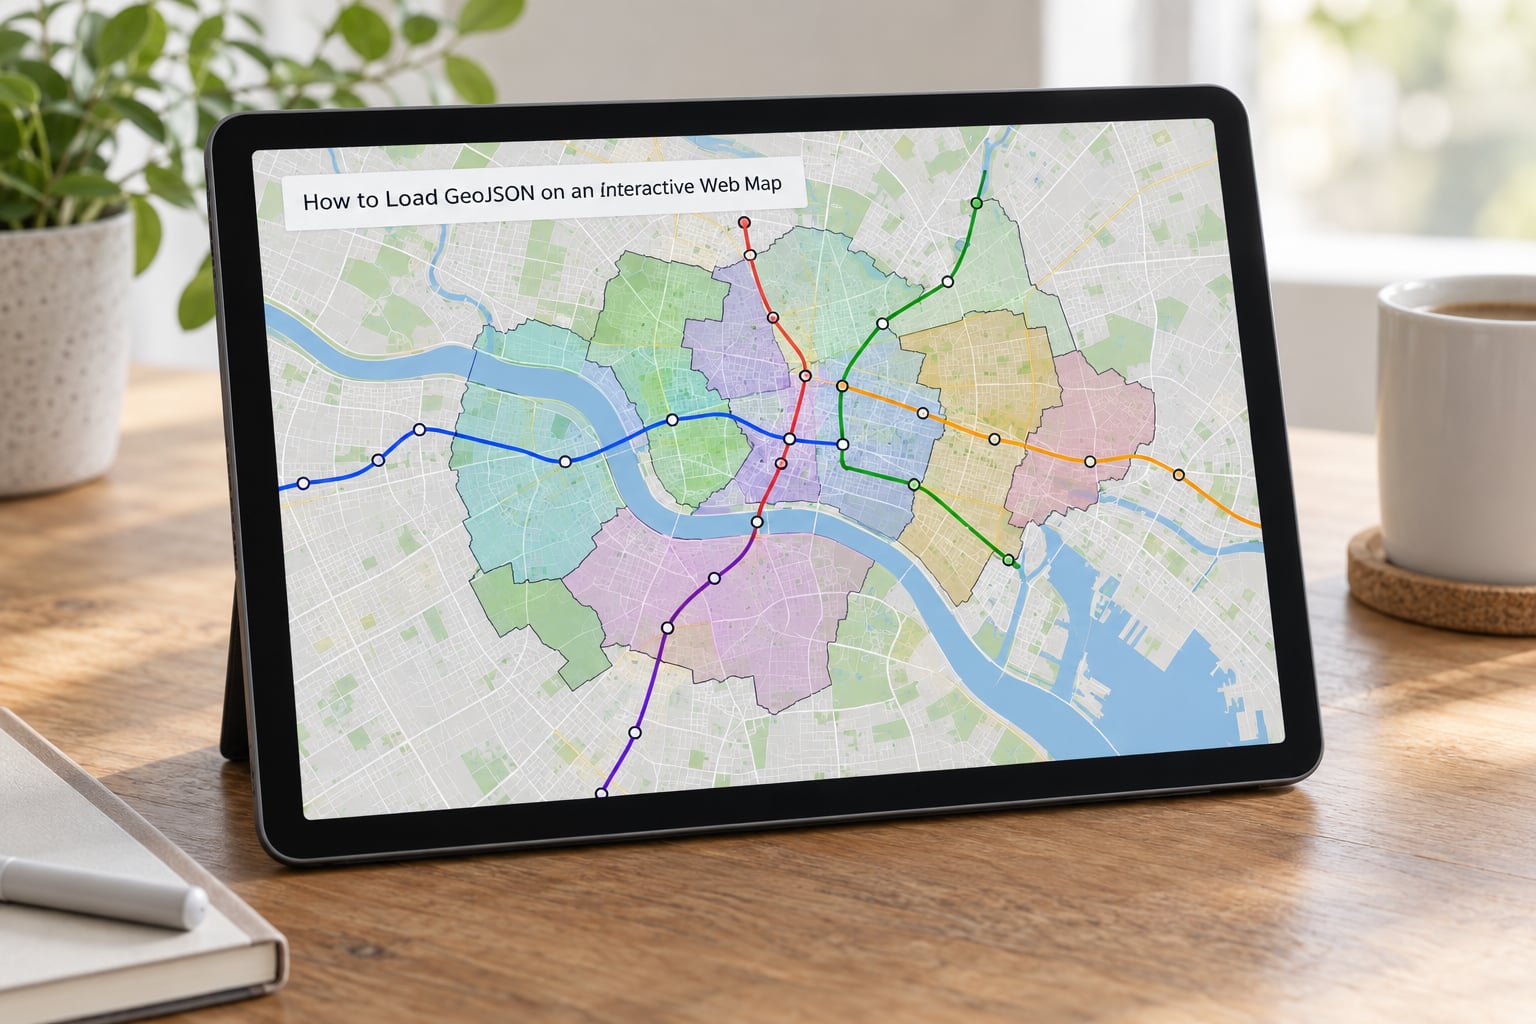
Every web map library follows the same two-step workflow: create a layer from the GeoJSON, then add that layer to the map. The library names differ, the shape of the call does not.
With Leaflet, which is the usual first choice for a lightweight civic map:
const map = L.map('map').setView([38.8977, -77.0366], 12);

L.tileLayer('https://tile.openstreetmap.org/{z}/{x}/{y}.png', {
  attribution: '© OpenStreetMap contributors'
}).addTo(map);

L.geoJSON(districts, {
  style: { color: '#333', weight: 1, fillColor: '#4a90d9', fillOpacity: 0.3 },
  onEachFeature: (feature, layer) => {
    layer.bindPopup(feature.properties.name);
  }
}).addTo(map);
With MapLibre GL JS, which handles vector styling and larger datasets more gracefully:
map.addSource('districts', {
  type: 'geojson',
  data: 'data/districts.geojson'
});

map.addLayer({
  id: 'districts-fill',
  type: 'fill',
  source: 'districts',
  paint: { 'fill-color': '#4a90d9', 'fill-opacity': 0.3 }
});

map.addLayer({
  id: 'districts-line',
  type: 'line',
  source: 'districts',
  paint: { 'line-color': '#333', 'line-width': 1 }
});
MapLibre lets you separate the fill and the outline into two layers, which is how you get a cleaner boundary than the single style object Leaflet gives you. It also supports data-driven styling, so a district can colour itself by its own property without you writing one layer per district.
Both libraries will happily load GeoJSON straight from a URL, but for anything bigger, serve the file yourself rather than reading it into the page. If your API returns GeoJSON, use the application/geo+json content type and enable CORS for whatever origin your map is served from. Turning on gzip usually cuts the payload by around three quarters, since GeoJSON is highly repetitive text.
Move to a server or spatial database when the dataset stops being something a browser can hold comfortably. Past roughly 10 to 20 MB of features, browsers start stuttering on pan and zoom because there is no spatial index in the format. That is the point where Postgres with PostGIS, or pre-tiled vector tiles, becomes the right answer rather than an optimisation.
How to Validate and Troubleshoot GeoJSON
Validate before you debug anything else. Paste the file into geojson.io and it will parse and render it immediately, or run it through a linter if you want a stricter verdict. Getting a clean parse first eliminates the whole class of problems that are really just broken JSON.
These are the failures that come up over and over:
Malformed JSON. A trailing comma after the last item in an object or array, a single quote instead of a double quote, or a smart quote pasted from a document. The file will not parse at all, and the error message usually points at the line. This is also why truncated examples from tutorials fail — check your closing braces first.
Reversed coordinates. GeoJSON writes positions as [longitude, latitude], not [latitude, longitude]. Swap them and your features land in the ocean, usually near the Gulf of Guinea, which is a memorably unhelpful error message. This single mismatch causes more broken maps than anything else.
Unclosed polygon rings. The first and last position of every ring must be identical. If yours end at a different point, the polygon renders as an open shape or not at all. Always five positions for a simple rectangle, not four.
Wrong nesting depth. A Point takes a bare array, a MultiPoint takes an array of arrays. Wrapping a Point one level too deep, or leaving a MultiPolygon one level too shallow, produces valid JSON that no renderer can interpret.
Unknown coordinate reference system. Older files from some GIS exports may carry a crs member, or may carry coordinates in a projected system like State Plane or UTM. RFC 7946 removed crs entirely and assumes WGS 84 decimal degrees, so if the numbers run to six digits and the shape looks stretched or absurd, reproject to EPSG:4326 before you draw it.
Blank map. Almost always one of the five above. The fastest check is the map’s own console: a JSON.parse error points at syntax, and a missing layer or null coordinates usually means the nesting or the CRS.
Slow map. A very large FeatureCollection rendering every feature at once. Simplify the geometry, drop unused properties, or tile it. Simplification is the quick win and costs you accuracy; a simplifier like mapshaper will tell you exactly how much area you gave up.
To build GeoJSON from a spreadsheet or CSV of lat and lon columns, the conversion is a loop and a wrapper object:
const features = rows.map(row => ({
  type: 'Feature',
  geometry: { type: 'Point', coordinates: [Number(row.lon), Number(row.lat)] },
  properties: { name: row.name, installed: row.installed }
}));

const collection = { type: 'FeatureCollection', features };
const json = JSON.stringify(collection);
Note the order: row.lon first. Keep that column order visible in the code and nobody will get it backwards.
Where Can You Find and Use GeoJSON?
Open city data portals are the richest source, and most publish a GeoJSON download or a plain HTTP endpoint alongside their human-readable pages. Transit agencies publish route alignments and stop locations. OpenStreetMap exports convert to GeoJSON through the same GDAL tooling that desktop GIS uses.
In application terms, the common uses are: overlaying council district or ward boundaries on a dashboard; drawing transit routes and bike-share stations; publishing air-quality, noise, or traffic sensor readings as points; attaching GPS traces to a trip report; and rendering building footprints for a 3D city view.
Two habits pay off every time. Publish the coordinate reference system, the update date, and the licence alongside the file, even though the format has no field for it — a data portal’s metadata page or a README in your repository is the place for it. And keep the properties schema consistent, because nothing in GeoJSON will catch you when it drifts.
Converting between formats is mostly handled by GDAL. A few commands cover almost everything:
# Shapefile to GeoJSON
ogr2ogr -f GeoJSON districts.geojson districts.shp

# GeoJSON to CSV (one row per feature)
ogr2ogr -f CSV output.csv districts.geojson

# GeoJSON to KML, for Google Earth
ogr2ogr -f KML districts.kml districts.geojson

# Simplify and re-export with mapshaper
mapshaper districts.geojson -simplify 10% -o simplified.geojson
For quick visual inspection and hand-authoring, geojson.io is the tool the community reaches for first. It draws as you edit, which makes it the fastest way to work out what a broken geometry is supposed to look like.
GeoJSON vs. Shapefile, GeoPackage, and Mapbox Vector Tiles
| Criterion | GeoJSON | Shapefile | GeoPackage | Mapbox Vector Tiles |
|---|---|---|---|---|
| Structure | One plain-text file | Five or more files with sidecars | Single SQLite file | Packed binary tiles |
| Encoding | JSON text | Binary with dBASE attribute tables | SQLite | Binary, zipped |
| CRS handling | WGS 84 only, no crs member | Carries a .prj file | Stores a full CRS definition | WGS 84, reprojected server-side |
| File size | Verbose, no topology sharing | Compact per feature | Compact, indexed | Smallest over the wire |
| Spatial index | None | Optional .qix | Built in | Built in per tile |
| Human readable | Yes, diffable in Git | No | No, query with SQL | No |
| Browser rendering | Native in every mapping library | Needs conversion first | Needs conversion or a server | Native in MapLibre and Mapbox GL |
| Best for | Web maps, APIs, open data, sharing | Legacy GIS and government portals | Editing, offline field work, desktop analysis | Large or frequently updated web layers |
The decision rule is short. If a browser or an API needs to read it, GeoJSON wins on effort and readability. If an analyst needs to edit geometry in the field or run spatial queries offline, GeoPackage wins. If a public-facing map needs to stay smooth past a few megabytes, vector tiles win.
Two more formats sit alongside these. TopoJSON stores shared points once and references them, so a boundary file can shrink considerably, at the cost of being unreadable to most mapping libraries directly. Newline-delimited GeoJSON — GeoJSONSeq or GeoJSONL — puts one feature per line so a large file can be streamed and appended to, which suits live feeds like sensor data.
Frequently Asked Questions
Is GeoJSON still used?
Yes, and it is still the default for web mapping. Leaflet, MapLibre GL JS, Mapbox GL JS, OpenLayers, deck.gl, PostGIS, QGIS, and ArcGIS all read it natively, and RFC 7946 has been the IETF standard since 2016. For very large or high-traffic datasets teams are moving to vector tiles, but GeoJSON stays the interchange format underneath, and it remains the sensible choice for API responses, open data portals, and anything under a few megabytes.
Can GeoJSON contain elevation or time data?
Elevation, yes. A position can carry a third value, so [longitude, latitude, elevation] is valid, and the first two positions of a LineString must match. Time has no native home in the format. The common approach is to store a timestamp in the feature’s properties object and sort features by it, or to use newline-delimited GeoJSON so a live feed can be appended to line by line.
Why is my GeoJSON map showing in the wrong location?
Two causes cover almost every case. First, coordinate order: GeoJSON writes [longitude, latitude], and swapping them drops your features in the ocean. Second, the coordinate reference system: RFC 7946 assumes WGS 84 decimal degrees, so a file exported in State Plane or UTM needs reprojecting to EPSG:4326 before drawing. Paste the file into geojson.io first — if it renders in the wrong place there too, the data is the problem, not your code.
Can I edit GeoJSON in QGIS?
Yes. QGIS opens a .geojson file like any other vector layer, and the editing toolbar works normally on points, lines, and polygons. Saving writes GeoJSON back out, which makes QGIS a practical way to fix coordinates by hand, digitise new features from imagery, or reduce a messy file to a clean subset. Set the layer CRS to EPSG:4326 when you load it so exports come back in the format expects.
Should I use GeoJSON or GeoPackage?
Use GeoJSON when a browser or an API consumes the data and someone may need to read or hand-edit it as text. Use GeoPackage when the data lives in desktop GIS, needs offline field editing, or has more than a few thousand features and needs a spatial index. GeoPackage is a single SQLite file with indexing and CRS support built in, which is exactly what GeoJSON deliberately leaves out.
Is a GeoJSON file the same as Google Maps data?
No. Google Maps consumes GeoJSON, but its own data model and coordinate handling are separate. The confusing part is the API: Google Maps JavaScript methods such as LatLngLiteral expect {lat, lng}, while GeoJSON positions are [longitude, latitude]. Swap the values when you hand data across, and note that Google Maps’ Data layer and some importers are stricter about file size and property types than open mapping libraries are.
Conclusion
GeoJSON is JSON with a fixed shape: a FeatureCollection holding Features, each with a geometry object in [longitude, latitude] WGS 84 decimal degrees and a freeform properties object for attributes. That is the whole idea, and it is why the format works so well on the open web.
Start by opening a small FeatureCollection in a text editor. Read the properties out loud, paste it into geojson.io, and change one coordinate to see the map move. Learn to read and inspect properties, then learn to validate before you build — that habit alone will save you an afternoon of debugging a blank map later.
Once you are comfortable, load it with Leaflet or MapLibre, and reach for Turf.js when the question is about distance, area, or containment rather than drawing. If you have hit the point where the file is too big for a browser, that is the signal to move to vector tiles or PostGIS, not to keep pushing GeoJSON past its design.