
To learn Python for data analysis, build three layers in order: a small core of Python syntax, the pandas and NumPy libraries for handling data, and Matplotlib and Seaborn for showing results. Then apply all of it to a messy real dataset, because clean tutorial data teaches you almost nothing.
The honest version takes about 12 weeks at five hours a week, and the order matters far more than the resources you pick. Most beginners stall because they try to learn all of Python before touching a single dataset, and six months later they still have nothing to show. As one r/learnpython poster put it plainly: beginners get stuck trying to learn all of Python before touching data analysis.
This roadmap is the sequence I would hand someone starting on Monday. It follows the same syllabus the popular video courses use, from a Jupyter notebook through pandas DataFrames into cleaning, grouping and charts, and it finishes with a full project on a civic dataset.
If you already use Excel or SQL daily, skim Step 1 and start at Step 2. Your existing habits transfer faster than most people expect.
Table of Contents
- What You Need
- Step-by-Step: How to Learn Python for Data Analysis
- Step 1: Learn the Python Basics You Actually Need
- Step 2: Practice With Small Real-World Datasets
- Step 3: Clean and Prepare Data With pandas
- Step 4: Explore the Data and Find Useful Patterns
- Step 5: Create Clear Charts With Python
- Step 6: Learn the Statistics Needed for Honest Analysis
- Step 7: Build a Complete Data Analysis Project
- Step 8: Practice Until You Can Work Independently
- Common Mistakes
- Frequently Asked Questions
- Do I need to learn all of Python before data analysis?
- How long does it take to learn Python for data analysis?
- Which Python libraries do I need for data analysis?
- What are the top 3 skills for a data analyst?
- Is Python still worth learning today?
- Do I need SQL if I learn Python for data analysis?
- Your First Week: Four Tasks That Get You Moving
What You Need
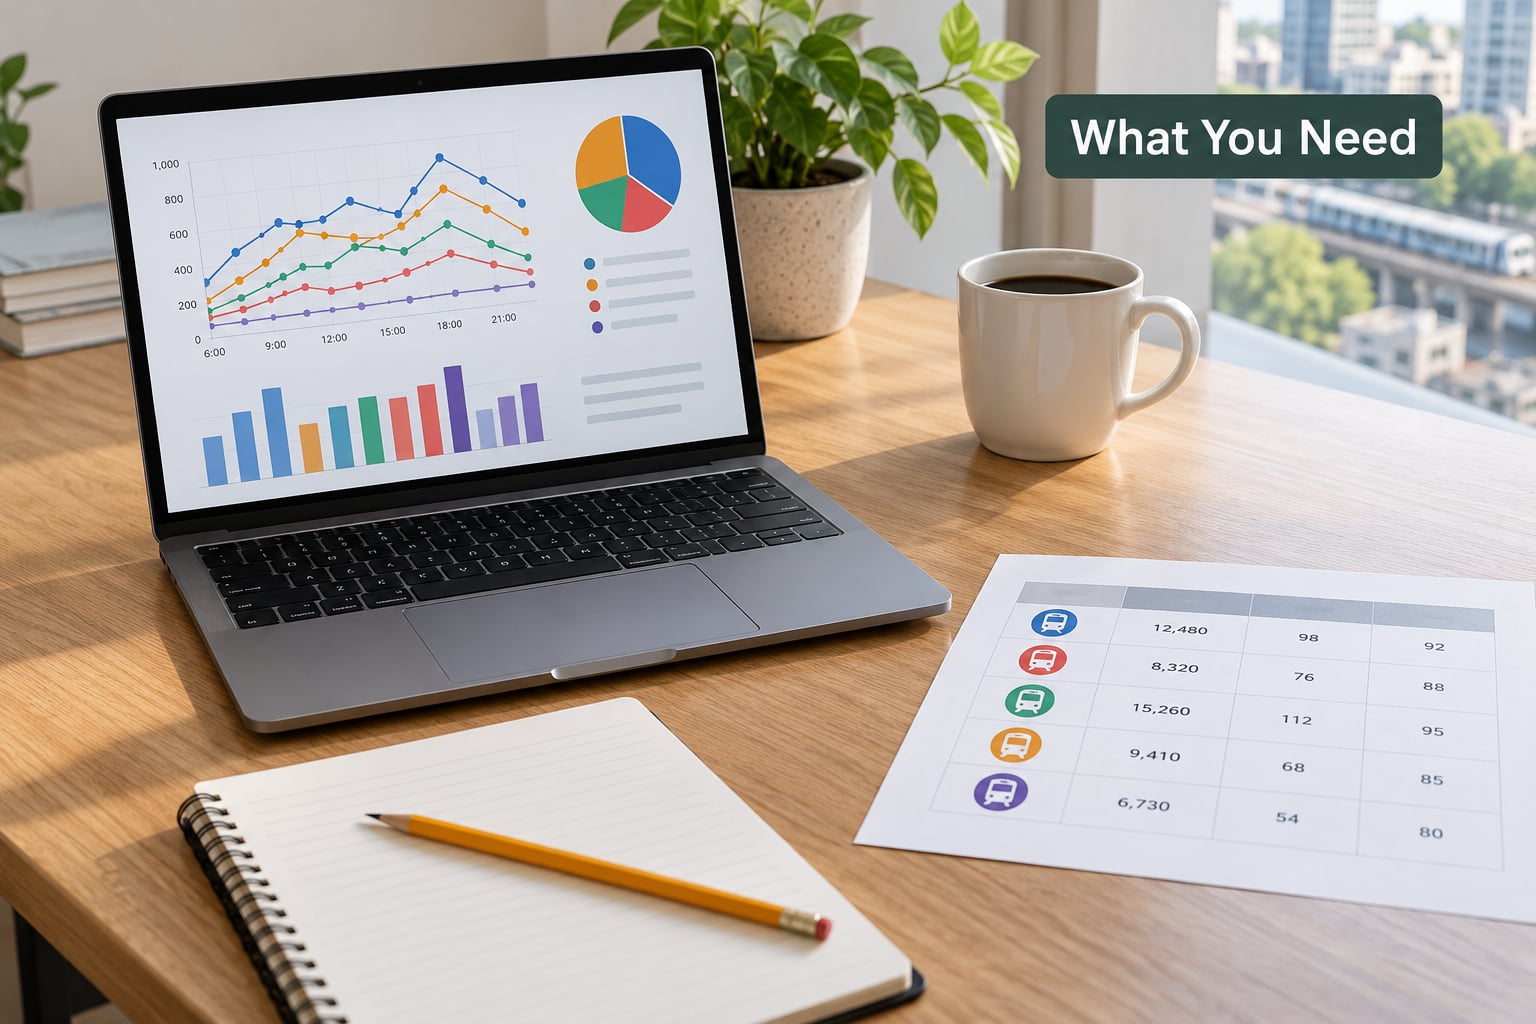
You need four things, and only one of them is a purchase decision you have to think about. Everything else installs in under an hour.
Python 3. Grab the current stable release from python.org. Skip the Anaconda full distribution if you can, because it ships hundreds of packages you will never touch and makes version conflicts harder to see. Miniconda is a fine middle ground when a course explicitly assumes it.
An editor that runs notebooks. JupyterLab through the Jupyter notebook interface is the standard analyst environment: you write code in cells, run them top to bottom, and keep text, output and charts in one file you can show someone. VS Code with the Jupyter extension works just as well and is better once you start writing reusable scripts.
The four core libraries. pandas for tables, NumPy for arrays, Matplotlib for charts, Seaborn for prettier charts. Install them together into a virtual environment so a project can be moved or deleted without breaking anything else on your machine.
A dataset with some dirt in it. This is the piece most guides skip and the piece that actually matters. Real data has blank cells, duplicate rows, inconsistent spellings and dates in three different formats. Start with a city open data portal or a public agency CSV, not a tutorial file that is already perfect.
Git is worth adding at some point, but not in week one. Getting a repository running is a distraction until you have something you want to keep.
For a quick orientation, here is the stack in the order I would teach it:
| Library | What it does | Learn it at |
|---|---|---|
| pandas | Loads, reshapes and summarizes tabular data | Weeks 3 to 7 |
| NumPy | Fast arrays and the math behind them | Week 3 |
| Matplotlib | The base charting library everything else uses | Weeks 8 to 9 |
| Seaborn | Statistical charts on top of Matplotlib | Week 9 |
| SciPy | Tests, distributions, optimisation | Month 4 onward |
| statsmodels | Regression and time series models | Month 4 onward |
| Scikit-learn | Machine learning on tabular data | After the portfolio works |
Nothing below the first four rows is needed to finish this roadmap. Pandas and NumPy alone cover the overwhelming majority of a working analyst’s day.
Step-by-Step: How to Learn Python for Data Analysis
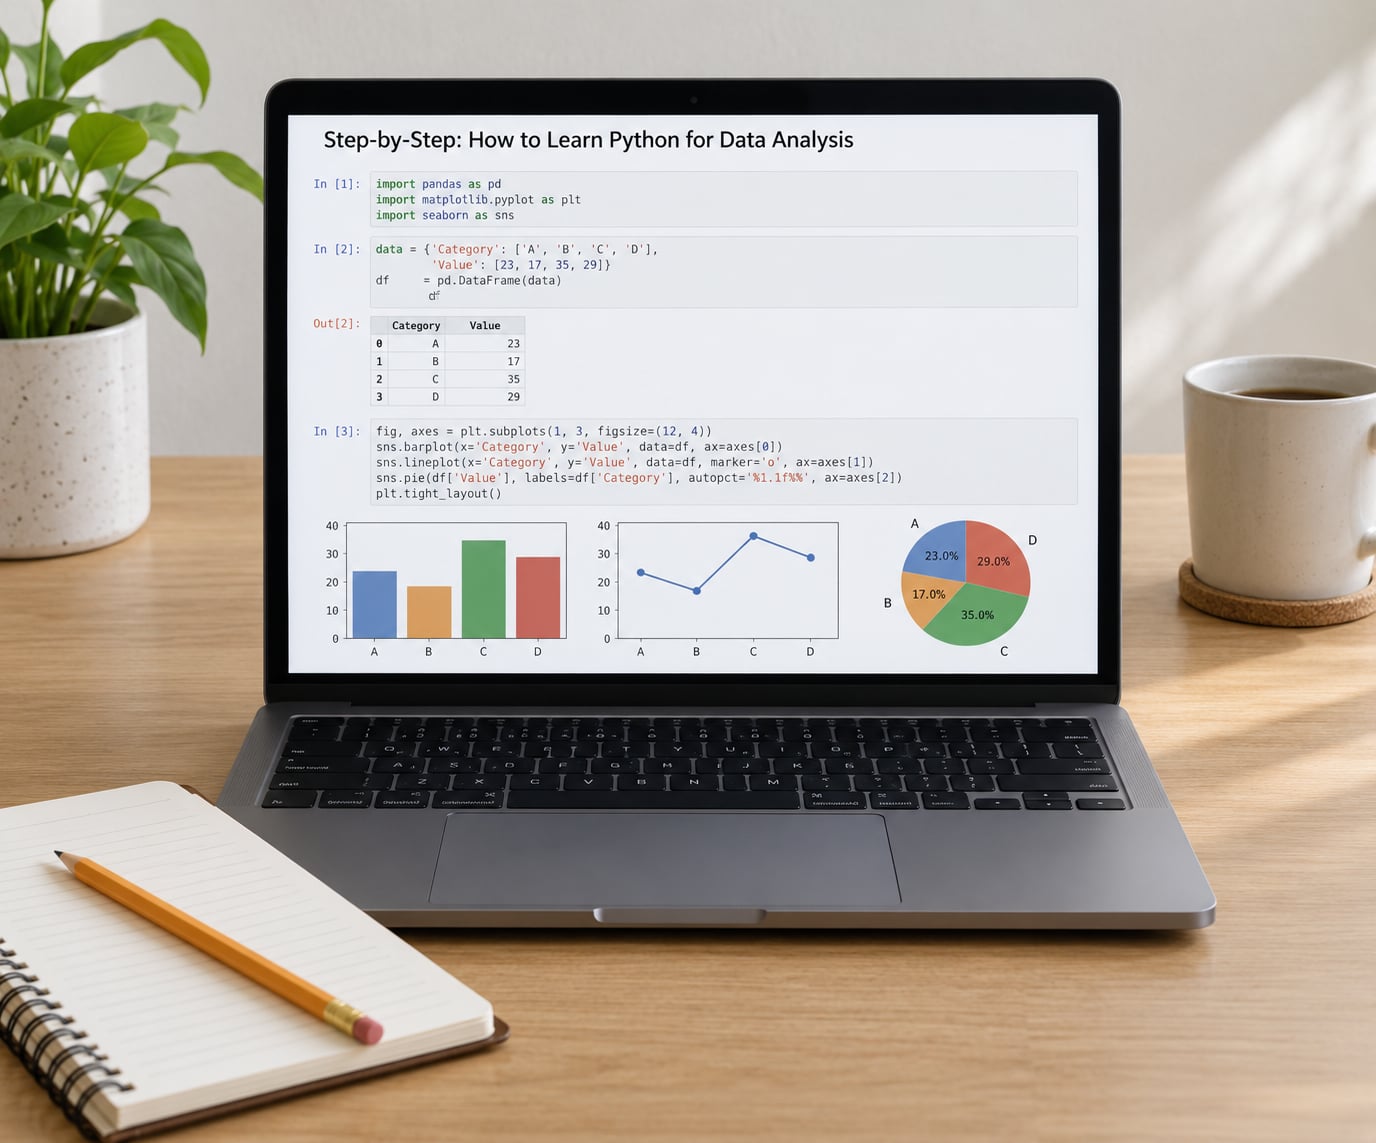
Each step below ends with a deliverable, because “I watched the videos” is not a milestone. If you can produce the thing in bold at the end of a step, you are ready to move on. If you cannot, stay on that step for another week.
| Week | Focus | Deliverable | Hours |
|---|---|---|---|
| 1 | Variables, strings, numbers | Script that prints computed values | 5 |
| 2 | Lists, dictionaries, loops, functions | Script that counts records by type | 5 |
| 3 | NumPy arrays and vectorised maths | Five array exercises | 5 |
| 4 | Loading CSVs into DataFrames | First inspected DataFrame | 5 |
| 5 | Selecting rows and columns | Five filtered summaries | 5 |
| 6 | Missing values and duplicates | Cleaned DataFrame with a change log | 5 |
| 7 | Dates and calculated columns | Time series derived from raw text | 5 |
| 8 | groupby and aggregation | Three questions answered | 5 |
| 9 | Matplotlib basics | One labelled bar chart | 5 |
| 10 | Seaborn distributions and relationships | Histogram plus scatter plot | 5 |
| 11 | Statistics for honest claims | Written interpretation with caveats | 4 |
| 12 | Full portfolio project | One published notebook and short write-up | 8 |
If you can only give it three hours a week, double every week number rather than rushing two skills into one sitting. Skills that are stacked on top of an unsteady base take longer to fix later.
Step 1: Learn the Python Basics You Actually Need
You need six things before pandas, and the boundary is firmer than most courses admit: variables and basic types, strings, lists, dictionaries, loops and conditionals, and functions.
That is genuinely the whole list. You can skip classes, inheritance, decorators, generators and metaclasses for now, and most working analysts go years without touching some of them. r/learnpython advice tends to land here too, with community consensus being that fundamentals come first and everything else can wait.
Here is the minimum viable Python syllabus. If you can read and write these, move on:
- Assigning variables with
=and changing types withint(),float(),str() - Indexing and slicing strings and lists
- Appending to and iterating over lists
- Building a dictionary with key and value pairs and pulling values out of it
forloops andif/elif/elseconditionals- Writing a function with arguments and a return value, and importing a library
Your exercise for this step: take a CSV file of city service requests, read it with the built-in csv module, and count how many records fall into each request type using a dictionary. It is ugly code, and that is fine. The point is that you are reading a file, looping over rows and building a tally.
If that exercise takes more than two hours, slow down rather than pushing ahead. Everything after this step assumes the loops click.
Step 2: Practice With Small Real-World Datasets
Now you move from the standard library to pandas, which is where data analysis actually begins. A DataFrame is a table with rows and columns where each column has a name and a type, and that is the whole mental model you need for two weeks.
Start with read_csv() and inspect before you touch anything:
import pandas as pd

df = pd.read_csv("service_requests.csv")
df.head()
df.info()
df.describe()
head() gives you the first few rows. info() tells you the shape, each column’s type and how many values are missing. describe() gives counts, means, spread and quartiles for numeric columns only.
Before you write any cleaning code, write down three questions you want the data to answer. “Which neighborhoods generate the most requests per thousand residents” is a question. “Analyse this dataset” is not. Community advice keeps landing on this point: ask a real question and use Python to answer it, rather than drilling function calls on sight.
Good beginner datasets are transit trip records, air quality readings, library visit counts or a city’s 311 call log. All four have missing values, inconsistent categories and dates stored as text, which is exactly what you want to practise on.
Step 3: Clean and Prepare Data With pandas
Cleaning is where most of an analyst’s actual hours go. In a typical analysis it is more work than the modelling or the charting combined, and tutorials that skip it are teaching you the easy 30%.
df.isnull().sum()
df.drop_duplicates()
df["category"] = df["category"].str.strip().str.title()
df["date"] = pd.to_datetime(df["date"], errors="coerce")
df["month"] = df["date"].dt.to_period("M")
df = df.dropna(subset=["date", "category"])
Check missing values with isnull().sum() before deciding what to do with them, because the counts tell you whether a column is unusable or merely patchy. dropna() removes rows, fillna() replaces values, and choosing between them is a judgement about the data that you should write down in a sentence.
Two habits separate people who can do this from people who copied a notebook. First, work on a copy: assign the result of each step to a new variable name rather than editing in place. Second, keep a running note of every cleaning decision. When a colleague asks why 4% of rows vanished, you want an answer other than “the tutorial said to”.
Step 4: Explore the Data and Find Useful Patterns
Exploration means answering written questions with summaries, then noticing which summaries are odd enough to be worth a chart.
summary = df.groupby("neighborhood")["trip_minutes"].agg(
    trips="count",
    avg_minutes="mean",
    median_minutes="median"
).sort_values("avg_minutes", ascending=False)

summary.head(10)
Compare average travel times across neighborhoods and you will quickly see why the median matters. A handful of very long trips pull a mean upward, and a difference that looks dramatic in the average often shrinks to nothing in the median.
Do not skip straight to “therefore the west side is slower”. Check whether those trips are mostly commute hours, whether some stations have very few records, and whether riders on those routes are going longer distances. An observed difference and a cause are different claims, and separating them is the job.
Step 5: Create Clear Charts With Python
Matplotlib is the base library; Seaborn sits on top and gives you statistical charts with less code. Learn Matplotlib first so you understand what Seaborn is doing for you.
import matplotlib.pyplot as plt
import seaborn as sns

sns.histplot(df["trip_minutes"], bins=40)
plt.xlabel("Trip length (minutes)")
plt.ylabel("Number of trips")
plt.title("Trip length distribution")
Match the chart to the question. Bar charts compare categories, line charts show change over time, scatter plots show the relationship between two numeric variables, and histograms show a distribution. A pie chart almost never beats a sorted bar chart.
Label both axes, start bar axes at zero, and never crop a line chart’s axis to exaggerate a small move. One chart, one message. If you need a second panel, it is usually two charts.
Step 6: Learn the Statistics Needed for Honest Analysis
You do not need a statistics degree. You need to understand averages, medians, spread, distributions, correlation and what a sample can and cannot prove.
Average versus median you already met in Step 4. Spread tells you whether a summary number is trustworthy, because two neighborhoods with the same average trip time can be completely different places. A histogram shows you the shape of the data behind the average, including the outliers and the second hump that a summary hides.
Correlation measures how strongly two numeric variables move together. It does not tell you direction or cause, and it can be driven entirely by one outlier. “Longer trips correlate with lower satisfaction” is a defensible observation. “Longer trips cause lower satisfaction” is a claim you would need a designed study to support.
Two habits keep you honest: state how many records the summary covers, and write the interpretation before you look at the chart that confirms it.
Step 7: Build a Complete Data Analysis Project
This is the step that produces something a hiring manager or a city colleague will actually read. Pick one question and take it all the way through, using a public civic dataset where you can.
A good first project: decide where to add secure bike parking. Load the trip data and the station location data, clean both, work out which stations have high ridership but no secure parking, then present a short recommendation with the caveats attached.
The structure that works is the same every time:
- State the question in one sentence, including who the recommendation is for.
- Load the data and record where it came from and when.
- Clean it, with a written note of every decision.
- Analyse it, answering the question directly with grouped summaries.
- Chart the two or three results that carry the argument.
- Document the assumptions and what the data cannot tell you.
- Give one recommendation a person can act on.
Publish it as a notebook with a short written summary at the top. The write-up is the part people read; the code is the proof.
Step 8: Practice Until You Can Work Independently
Skill in data analysis arrives through repetition on unfamiliar data, not through one long course. By week 12 you should be running a loose routine you can keep for years.
Once a week, take a dataset you have never seen and answer one question end to end in a single session. Once a week, read someone else’s notebook and explain it to yourself line by line. Once a month, rebuild an analysis you did three months earlier from scratch without looking at the old code.
Track three checkpoints, because these are the ones that separate independent analysts from tutorial followers:
- Can you read unfamiliar code and say what it does before running it?
- Can you debug an error from the traceback message alone?
- Can you explain a finding to someone who does not write code, and say what you are not sure about?
If the first two are shaky, keep coding small exercises. If only the third is shaky, that is a communication gap, not a Python gap, and it is fixed by writing.
Common Mistakes
Trying to learn all of Python first. This is the most common reason people quit. The fix is the boundary in Step 1: six concepts, then pandas. Everything else you can learn the day you need it.
Copying notebooks without changing anything. You get the feeling of progress and none of the skill. Fix: after every tutorial you run, delete one line and predict what breaks. Then break it on purpose.
Ignoring missing values. A dataset with 30% blanks in a key column produces confident nonsense. Fix: run isnull().sum() as your third line of code, every time, and decide what to do about each column out loud.
Choosing a misleading chart. Truncated bar axes, pie charts with nine slices, a dual-axis line chart, rainbow colours for a five-category bar chart. Fix: sorted horizontal bars, labelled axes, zero baseline, one message per chart.
Reading correlation as causation. Fix: write the word “associated with” instead of “caused”, then add one sentence describing what else could explain the pattern.
Not documenting the analysis. Fix: keep a running markdown note next to the notebook with the data source, the date downloaded, and every cleaning decision. It takes five minutes and it is the difference between analysis you can defend and analysis you cannot.
Porting an Excel habit directly into code. Most Excel users do this for two weeks and then relax, because they assume the syntax transfers. A few translations help:
- VLOOKUP or XLOOKUP becomes
merge() - Pivot table becomes
groupby()withagg() - Filter becomes boolean indexing with
loc - Fill down becomes
ffill() - Concatenate becomes
pd.concat() - IFERROR becomes
.fillna()or a conditional expression
The fastest ROI for an Excel user is usually automating a report they already build by hand every month. You already know the question; you are only replacing the clicking.
Frequently Asked Questions
Do I need to learn all of Python before data analysis?
No. You need six things: variables and basic types, strings, lists, dictionaries, loops with conditionals, and functions. Classes, decorators, generators and async code can wait months. Start loading a CSV in week three and learn the rest when a task forces it. Most working analysts go long stretches without touching what beginners try to master first.
How long does it take to learn Python for data analysis?
At five hours a week, roughly 12 weeks gets you from no Python to a finished portfolio project: two weeks of syntax, six weeks of pandas, two of charts, one of statistics and one of project work. Three hours a week stretches that to five or six months. Twenty hours a week compresses it to about six weeks, mostly because context switching is the real cost, not hours.
Which Python libraries do I need for data analysis?
Four to start: pandas for tables, NumPy for arrays and the maths behind them, Matplotlib for charts, and Seaborn for statistical charts. Add SciPy and statsmodels once you are doing formal testing or regression, and Scikit-learn only after your end-to-end analysis already works. Installing the full scientific stack in week one slows you down for no gain.
What are the top 3 skills for a data analyst?
Querying with SQL, cleaning and preparing data with pandas, and communicating findings visually. Python alone is not the differentiator, because nearly every analyst posting asks for it. The skill that separates candidates is usually the middle one: handling messy data, explaining what you removed and why, and writing down your assumptions so someone else can reproduce the result.
Is Python still worth learning today?
Yes. It remains the dominant language across data analysis, data science and machine learning, and pandas and NumPy are mature enough that you will not outgrow them. The practical argument is that Python connects everything else you touch at work: databases through SQLAlchemy, spreadsheets, APIs, dashboards and models. What has changed is the surrounding tooling, not the core value of the language.
Do I need SQL if I learn Python for data analysis?
Yes, and it is the cheapest skill on this list. Most data sits in a database, so pulling it with SQL is faster and cheaper than downloading files, and job descriptions list it constantly. Learning basic SELECT, WHERE, GROUP BY and JOIN takes a weekend. Read the results into pandas with read_sql and you have the whole pipeline.
Your First Week: Four Tasks That Get You Moving
Do these four things and nothing else this week. They are the whole beginning of how to learn Python for data analysis, and skipping ahead to a course playlist is how people end up three months in with nothing finished.
Install Python and open a Jupyter notebook. Write a script that reads a city service request CSV with the built-in csv module and counts records by type. Download one genuinely messy public dataset from a city open data portal and inspect it with head(), info() and describe(). Then write one sentence about what you would want to find out.
That last sentence is the part most people skip, and it is the part that decides whether the next eleven weeks go anywhere.