A mobile app A/B test puts your users into two groups at random. One group sees the version you already ship, the other sees a single changed element, and analytics tells you which version moved the number you care about.
That is the whole idea, but the mechanics are where most teams get stuck. How does a phone know which group it belongs to? What happens when someone reinstalls the app? How long do you wait before calling it? This guide walks through the full workflow, then gets into the mobile-specific parts that web-only guides tend to skip.
Table of Contents
- What Is A/B Testing in a Mobile App?
- How Does A/B Testing Work in Mobile Apps?
- 1. Write the hypothesis first
- 2. Define one primary metric
- 3. Choose the audience and traffic split
- 4. Wire up assignment and instrumentation
- 5. Ship and let it run
- 6. Watch exposure and data quality
- 7. Decide and document
- How users actually get bucketed on a device
- How to Choose What to Test
- Set the audience before you design the variant
- Write the hypothesis so it can fail
- Prioritise by impact, confidence and effort
- Which Mobile App Metrics Should You Measure?
- How Many Users Does a Mobile App A/B Test Need?
- What to do when traffic is thin
- What Does a Valid A/B Test Look Like?
- Statistical significance is not the same as a meaningful improvement
- Common Mobile App A/B Testing Mistakes
- How to Use A/B Test Results to Improve an App
- A/B Testing in Civic and Smart-City Apps
- Frequently Asked Questions
- What does the statistical significance level indicate in an A/B test?
- How long should a mobile app A/B test run?
- Are there differences between A/B testing on iOS and Android?
- Do I need a new app store submission to run an A/B test?
- What are the best A/B testing tools for mobile apps?
- What is the difference between statistical and business significance?
- Conclusion: Start With One Clear App Hypothesis
What Is A/B Testing in a Mobile App?
A/B testing in a mobile app is a controlled experiment where a randomized slice of your users receives one version of an experience and the rest receives another. The control group sees the current design, the variation group sees the change you want to evaluate.
The critical constraint is one change at a time. If you change the button colour, the copy and the screen order in the same test, a win tells you the combination works but never which piece did the work. Teams that skip this rule end up shipping changes for the wrong reason.
| Control and variation at a glance | Control | Variation |
|---|---|---|
| What users see | The experience that already ships | One modified element |
| Traffic share | Usually 50 percent, sometimes more for a cautious rollout | The remainder |
| Assignment | Random, sticky per user ID | Random, sticky per user ID |
| What stays fixed | Everything else: build version, audience, measurement window | Everything else |
| How it is judged | Baseline the variant is measured against | Compared on the primary metric plus guardrails |
It is worth separating A/B testing from three things it often gets confused with. Usability testing watches a handful of people try a design and tells you why it confused them, not whether it performs better. Surveys ask what people think, which is not what they do. A multivariate test changes several elements at once and needs far more traffic to read a result.
How Does A/B Testing Work in Mobile Apps?
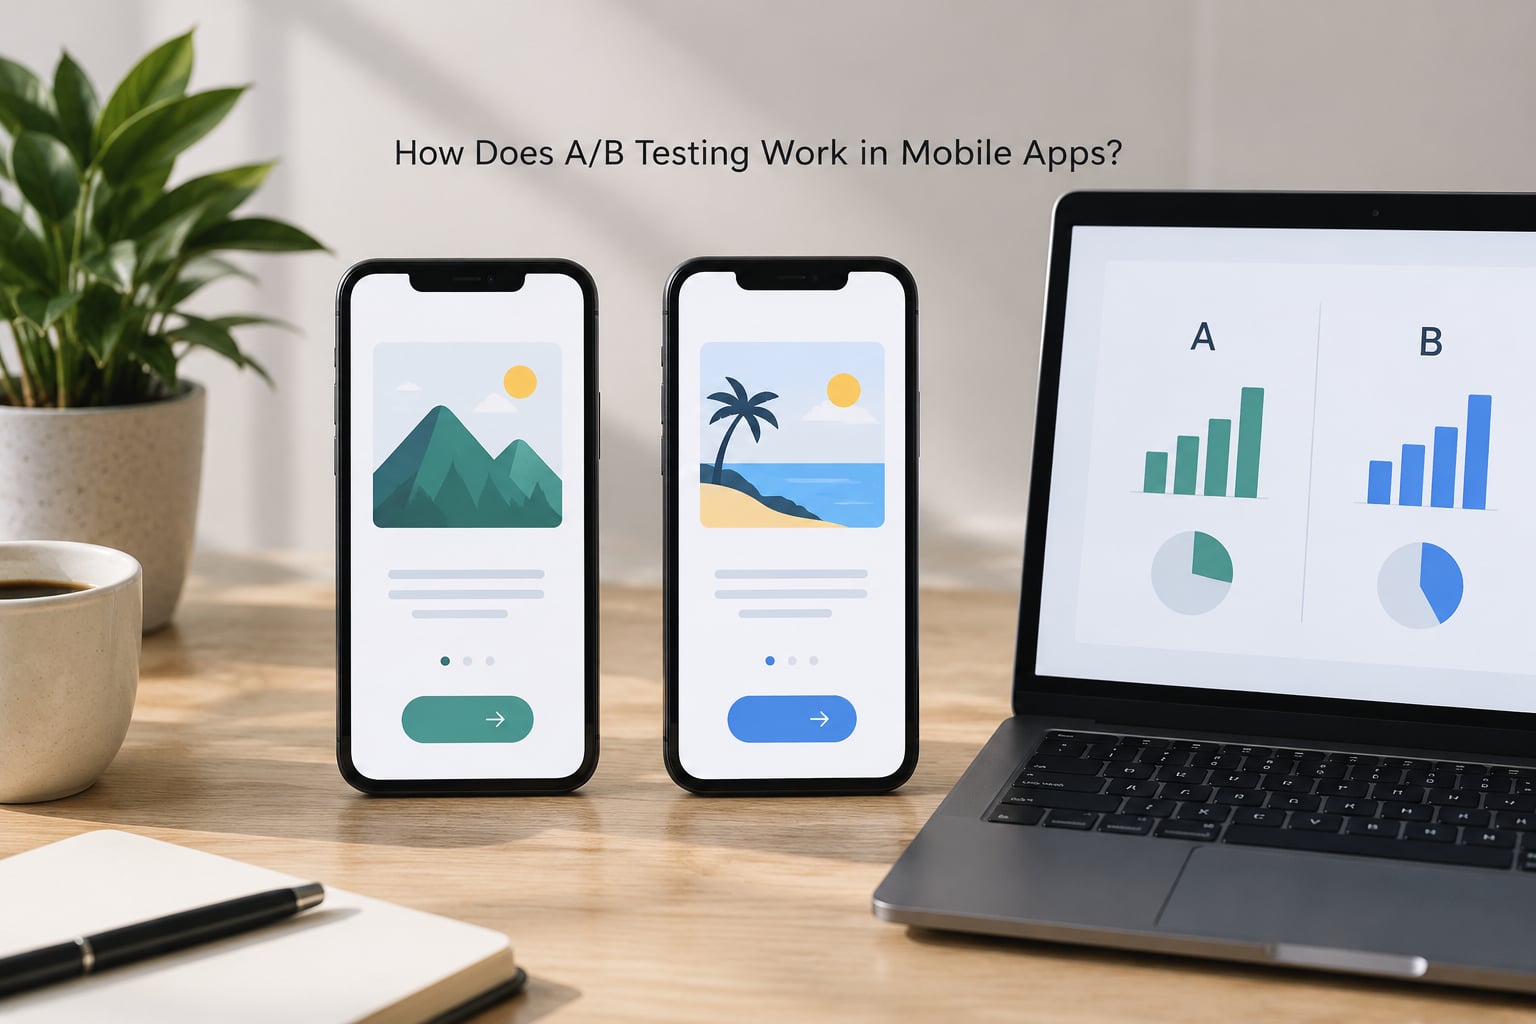
A mobile app A/B test works by assigning each user a stable variant on their device, usually by hashing an anonymous user ID so the same person sees the same version every session. The app then fires an analytics event when the measured action happens, the platform groups events by variant, and once enough data has accumulated to be trustworthy, you decide whether to ship the winner.
Here is the workflow, end to end.
1. Write the hypothesis first
You decide what you believe and what would change your mind. “New users who skip the permissions screen during onboarding are less likely to finish setup, so moving that prompt later should raise onboarding completion.” A test without a stated belief is just a change with a dashboard attached.
2. Define one primary metric
Pick the single number the change is expected to move, plus guardrail metrics that must not degrade. Decide this before launch, because picking the metric afterwards is how teams convince themselves a loss was a win.
3. Choose the audience and traffic split
New users only, users on a specific platform, or a percentage of everyone. Most first tests run 50/50 so the comparison is symmetric, and a smaller holdout on the control is sensible when a change carries real risk.
4. Wire up assignment and instrumentation
An experimentation SDK or remote config service handles the split. Confirm your exposure event and conversion event actually fire in both variants before anyone looks at results.
5. Ship and let it run
The variant reaches users through remote config or a store build. No app store submission is needed for most in-app tests, which is the main reason teams test here rather than waiting for the next release.
6. Watch exposure and data quality
Check that both arms receive roughly the traffic you expected. A gap between arms means something is wrong with assignment, not with your design.
7. Decide and document
Ship the winner to 100 percent, roll it back, or log the result as inconclusive and move on. Record what you tested, for how long and what you decided, so the next team does not repeat it.
How users actually get bucketed on a device
This is the part that surprises people coming from websites. There is no server-side split on every request. The SDK asks the remote config service for the experiment’s parameters, then computes an assignment locally by hashing the user’s anonymous ID with the experiment ID. The same ID and experiment produce the same number, so the assignment is stable without storing a lookup table.
That stability is what teams call sticky bucketing, and it is what makes the result readable. A user who sees the variant on day one must still see it a week later, otherwise their later behaviour gets attributed to the wrong group and the comparison breaks.
Two edge cases follow from the hashing approach. On reinstall or clearing app data, the anonymous ID is regenerated, so a user can land in either arm again. For experiments measured within a session that is harmless. For anything measured over weeks, teams usually pass a logged-in user ID instead, which survives reinstalls.
Offline behaviour depends on your SDK’s caching. Most platforms cache the last known config so an app opened on a train renders the correct variant rather than the default, which prevents the flash-of-wrong-variant problem where a user sees control layout for a second before the variant appears.
How to Choose What to Test
Not every screen deserves an experiment. Start where you have traffic, a plausible lever and a metric that already moves for reasons you understand.
Onboarding and permissions flows usually come first, because early drop-off is expensive and the screens are simple enough to change one thing at a time. Paywall and subscription screens are the classic revenue test, though they need clean subscription event tracking before any result means anything. Push notification and in-app message copy is cheap to test and quick to read, since you can often measure opens and downstream sessions within hours.
Navigation and menu structure, search result layout, empty states and error states all work well as tests because they affect a broad share of sessions. Store listing elements are a separate category handled by the platforms themselves, covered below.
Set the audience before you design the variant
A change aimed at new users should be tested on new users. Mixing new and returning users into one average hides the effect, because the two groups behave differently on almost every screen.
Write the hypothesis so it can fail
Good hypotheses name the change, the audience, the expected direction and the metric. That structure makes it obvious when the result says no, which is the point of running the test.
Prioritise by impact, confidence and effort
A common scoring approach rates each candidate idea on expected impact, your confidence it will work, and the effort to build and measure it. High-impact, low-effort screens go to the front of the queue, and anything that touches payments, authentication or consent usually waits until your pipeline is reliable.
Which Mobile App Metrics Should You Measure?
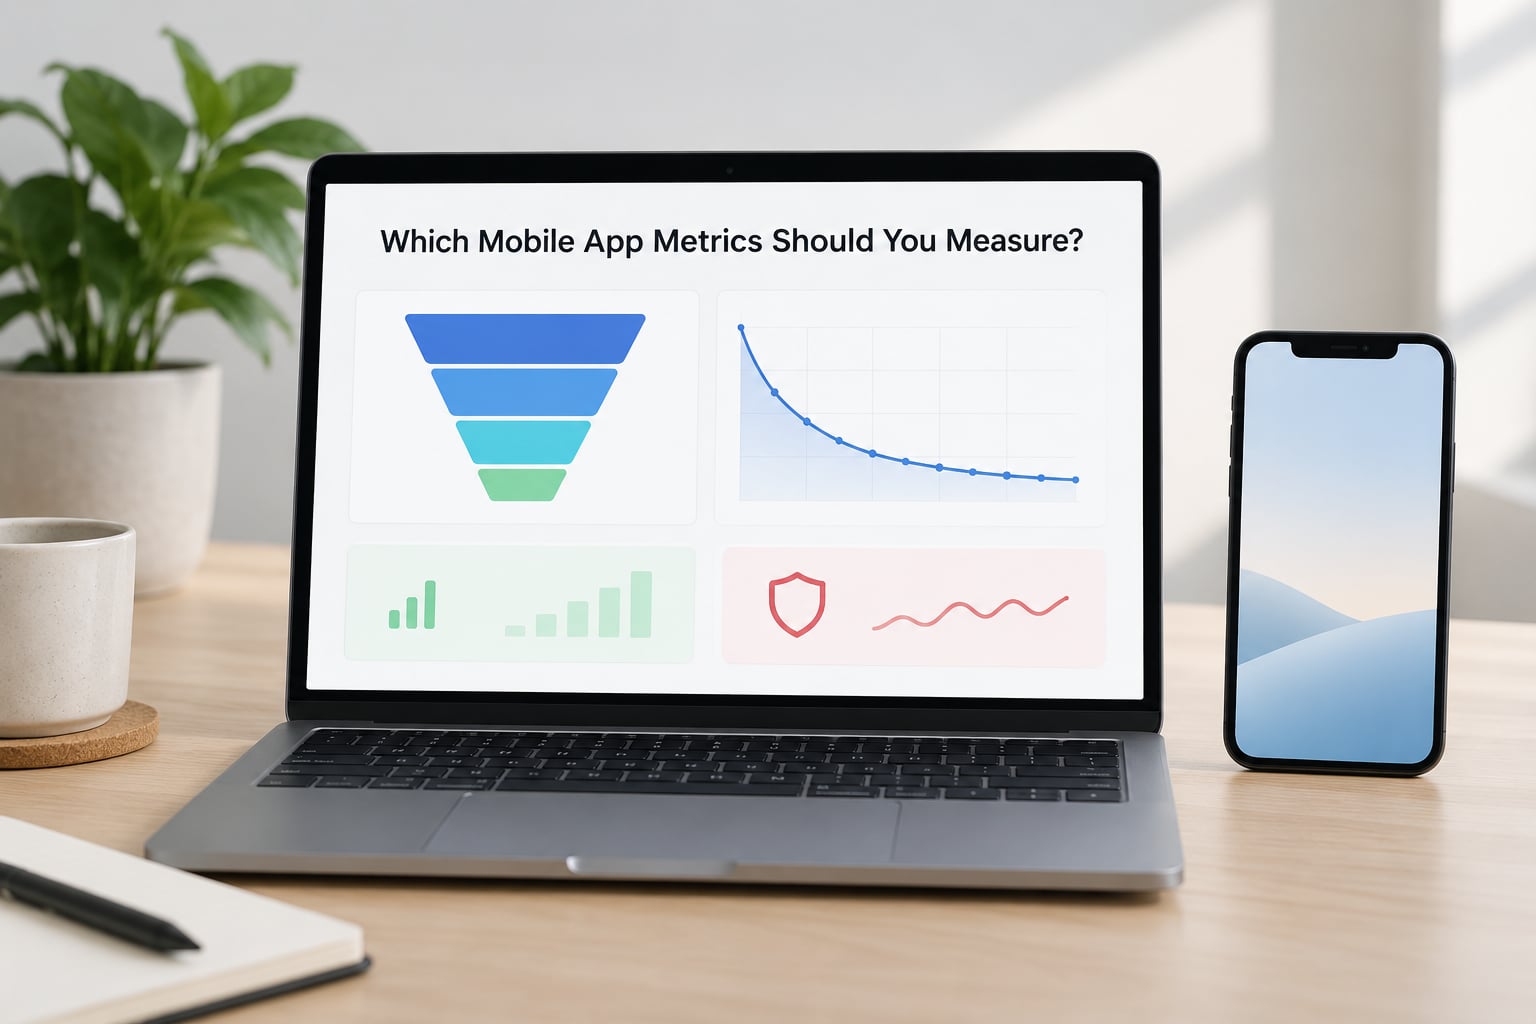
Choose one primary metric tied to the hypothesis and two or three guardrail metrics that must not get worse. Everything else is interesting context you read after the decision, not a substitute for the primary.
| Metric | What it tells you | Typical role |
|---|---|---|
| Onboarding completion | Share of new users who finish setup | Primary for onboarding tests |
| Trial or paywall conversion | Share who start or buy after seeing the screen | Primary for monetization tests |
| Day 1 and Day 7 retention | Whether users came back after the change | Primary or delayed guardrail |
| DAU and DAU over MAU | Daily actives and how broad the active base is | Guardrail |
| Screen views per session | Depth of use per visit | Secondary |
| Crash-free session rate | Whether the variant broke something | Hard guardrail |
| Time to first screen | Latency introduced by a heavier variant | Hard guardrail |
| ARPDAU or subscription revenue | Whether the change pays for itself | Secondary or primary for paywall tests |
Retention deserves special care because it moves slowly. If your change affects the first session, waiting for a meaningful retention difference means running the test for weeks, during which seasonality and marketing pushes muddy the picture. Many teams test the immediate metric first and treat retention as a follow-up check after rollout.
Guardrails exist to catch damage. A navigation change that lifts taps per session while pushing crash-free sessions down by half is not a win. Set a threshold before launch, such as no more than a small relative decline, and treat crossing it as a failure regardless of what the primary metric says.
What to avoid is picking the metric after the test ends. Choosing whichever number moved upward turns a research tool into a way to justify a change you already wanted.
How Many Users Does a Mobile App A/B Test Need?
Enough users to detect the improvement you care about at the significance level you set. That number depends on two things: your current baseline rate and the smallest relative change you would consider worth shipping.
A rough planning formula helps:
Sample per variant = 16 × p × (1 − p) / (MDE × p)²
where p is your baseline conversion rate expressed as a decimal and MDE is the minimum detectable relative effect, also as a decimal. The approximation assumes a 95 percent significance level and 80 percent power, which is the default most experiment platforms use.
Worked example: if onboarding completion sits at 40 percent and you want to detect a 10 percent relative lift, that is 0.40 with an MDE of 0.04. The formula gives roughly 15,000 users per variant, so about 30,000 total before you would expect a confident read.
Change the baseline and the requirement moves sharply. At a 2 percent paywall conversion rate, detecting a 10 percent relative lift needs roughly 78,000 users per variant, which is why low-conversion mobile events are so hard to test and why teams either widen the relative effect, extend the run, or lean on a different method.
Two practical notes. A larger sample is not automatically a better test: running 10,000 users against a 1 percent relative difference will usually land inside noise and tell you nothing. And sample size is a floor, not a schedule, because you also need enough time for a full weekly cycle so weekday and weekend behaviour are represented.
What to do when traffic is thin
Sequential testing, where you can look as data arrives under rules that control false positives, is one option. Multi-armed bandits, which shift traffic toward whichever variant is doing better, are another and are more efficient when you genuinely do not mind running all variants. Targeting the test at the highest-traffic surface you can is usually more effective than either.
What Does a Valid A/B Test Look Like?
A result you can act on has a specific shape. Use this as a checklist before you call anything a winner.
- Random, sticky assignment. Users are assigned by hashing an ID, not by device model, locale or a first-party attribute that correlates with behaviour.
- One meaningful change. A single element differs between arms, so the result has an explanation.
- Balanced exposure. The arms receive close to the traffic share you set. A persistent gap is called a sample ratio mismatch and usually means the SDK, the assignment call or the analytics event is broken.
- Full weeks of runtime. At least one complete business cycle, and longer when the metric depends on a habit.
- Consistent variants. Nobody edits the variation mid-test, and nobody changes the definition of the conversion event.
- Verified instrumentation. Exposure and conversion events fire in both arms, confirmed on real devices before launch.
- Stable build. A mid-test release that changes unrelated screens can move your metric for reasons that have nothing to do with the variant.
- A stated decision rule. You decide in advance what counts as a win and what you do with a loss.
Statistical significance is not the same as a meaningful improvement
Significance means the observed difference is unlikely to be chance noise given the sample size. Practical significance means the difference is big enough to matter to the product. A test with 500,000 users per arm can produce a statistically significant 0.4 percent lift, and it may still not be worth the maintenance cost, the added complexity and the review questions that come with it.
Look at the confidence interval, not just the verdict line. If it spans from a 2 percent gain to a 3 percent loss, you have learned that the change does something small and you do not yet know which way.
Common Mobile App A/B Testing Mistakes
Changing several elements at once. The result describes a combination, not an idea. Fix: one change per test, or a deliberate multivariate design with enough traffic for it.
Peeking and stopping the moment the p-value dips below 0.05. Checking continuously and stopping at the first crossing inflates your false positive rate well past the nominal 5 percent. Fix: fix the sample size and end date in advance, or use a sequential testing method designed for early looks.
Ending the test on a fixed day rather than a full cycle. Cutting a Thursday afternoon test because it is nearly the weekend reads a traffic pattern, not a design difference. Fix: run whole weeks.
Testing on a tiny or skewed audience. One region, one device tier or only users who already passed another flow produces results that do not generalise. Fix: check the population mix between arms and make it match your user base.
Running too many variants. Three or more arms multiply the traffic you need and widen the range of outcomes you have to interpret. Fix: keep it to control plus one variation unless traffic is genuinely large.
Treating a result as permanent. Novelty effects inflate early results: people click a new button out of curiosity, then the lift fades. Fix: check whether the effect holds when you re-read the same data after a week, and confirm after full rollout.
Ignoring offline and slow-network behaviour. A variant that renders correctly on wifi and breaks on a weak connection fails in the field even though the dashboard looks clean. Fix: test on low bandwidth and on the older devices your users actually carry.
Trusting segmented results without checking the whole. A segment can improve while the overall number falls, and reversing a segment can flip the aggregate entirely. Fix: read the total first, then segments, and treat small segments as directional at best.
How to Use A/B Test Results to Improve an App
A winner means roll out gradually, not flip on at 100 percent on a Tuesday afternoon. Move to 25 percent, watch the guardrails for a few days, then continue. If anything degrades, the rollback is a configuration change rather than a rushed store submission.
A loss is a useful result. Write down what you expected, what happened and why your theory might have been wrong, because that note becomes the starting point for the next hypothesis rather than a lost two weeks.
A flat result is the most common outcome and the easiest to waste. Usually it means the effect is smaller than the sample could detect, or the change addressed something nobody cared about. Decide explicitly whether to run longer, to widen the audience, or to stop.
Segment carefully when you do explore. Platform, acquisition channel, new versus returning, and locale can all behave differently, and a difference that disappears outside one segment is not a general improvement. Keep the number of segments you look at small, because the more you slice, the more you will find something that moved by luck.
Finally, archive the test. A searchable record of hypotheses, results and decisions is what turns one-off experimentation into a repeatable process, and it stops the team from rerunning a test that was already answered two quarters ago.
A/B Testing in Civic and Smart-City Apps
Public-facing apps carry constraints that commercial apps mostly ignore. Consent requirements can limit which segments you may evaluate, accessibility rules mean a variant that tests well with sighted users on a new phone may be worse for someone using a screen reader, and a share of users on older hardware or intermittent connectivity will hit any performance regression harder than your test population suggests.
The guardrail list here usually includes accessibility completion, time to first content on a slow connection, and error recovery rates on core services. It is also reasonable to exclude or cap tests on flows where a wrong variant would affect someone’s access to a public service, and to treat the slowest quarter of devices as a first-class segment rather than an afterthought.
Frequently Asked Questions
What does the statistical significance level indicate in an A/B test?
The significance level, usually 95 percent, is the confidence you have that the difference between control and variation is real rather than random variation in your sample. A 95 percent level means a 5 percent chance the result appeared purely by chance. Teams normally pair it with 80 percent power, which is the ability to detect the improvement you care about. Check the confidence interval too, since significance alone does not tell you whether the effect is large enough to ship.
How long should a mobile app A/B test run?
Run it for at least one full week so weekday and weekend behaviour are both represented, and longer if your metric depends on a habit or if traffic is thin enough that you need a larger sample. The real end condition is the sample size your baseline rate and target effect require, reached on a day that completes a business cycle. Ending early because the numbers look promising is the fastest way to ship a change that does not hold up.
Are there differences between A/B testing on iOS and Android?
The mechanics are the same on both platforms: an SDK hashes an identifier, returns a variant, and caches the assignment locally. The differences are practical. iOS users update less frequently because TestFlight and phased release slow rollouts, and App Store review adds delay before a build reaches anyone. Android has more device and OS fragmentation, so variant QA takes longer. Store listing tests run through different consoles with different limits on each platform.
Do I need a new app store submission to run an A/B test?
For most in-app tests, no. Variants are delivered through remote config or an experimentation SDK, so you can launch and stop an experiment without submitting a build. The exception is testing the app itself, such as a change baked into the binary, which needs a release. Store listing experiments for icons, screenshots and descriptions run through Google Play Store Listing Experiments and App Store Connect Product Page Optimization instead, and both require metadata review before a test begins.
What are the best A/B testing tools for mobile apps?
Firebase Remote Config paired with Google Analytics for Firebase is the common starting point for Android and web-connected apps, and it handles remote config well, but built-in A/B testing is still labelled Beta and needs custom events wired up by hand. Optimizely and Kameleoon serve larger organisations that want support and deeper targeting. GrowthBook and Statsig suit teams that want experimentation alongside feature flags and gradual rollout. Subscription-focused tools such as Adapty go deeper on paywalls and revenue metrics.
What is the difference between statistical and business significance?
Statistical significance asks whether a difference is unlikely to be random noise, given your sample size. Business significance asks whether the difference is worth shipping: does it move revenue or retention enough to justify the work and the added complexity? With a large enough sample you can reach statistical significance on a change worth almost nothing, which is why both tests should report a confidence interval and a minimum detectable effect set before the test starts.
Conclusion: Start With One Clear App Hypothesis
If you take one action from this guide, pick the screen where you lose the most users, write down what you believe is causing it, and run a single change against the people who hit that screen. Give it a primary metric, a guardrail and enough runtime to reach a sample your baseline rate actually supports.
The mechanics are the easy part once an SDK is installed. What separates teams that improve their apps from teams that argue about buttons is a written hypothesis, a fixed decision rule and an archive of past results, so that understanding how A/B testing works in mobile apps becomes a habit rather than a one-off project.