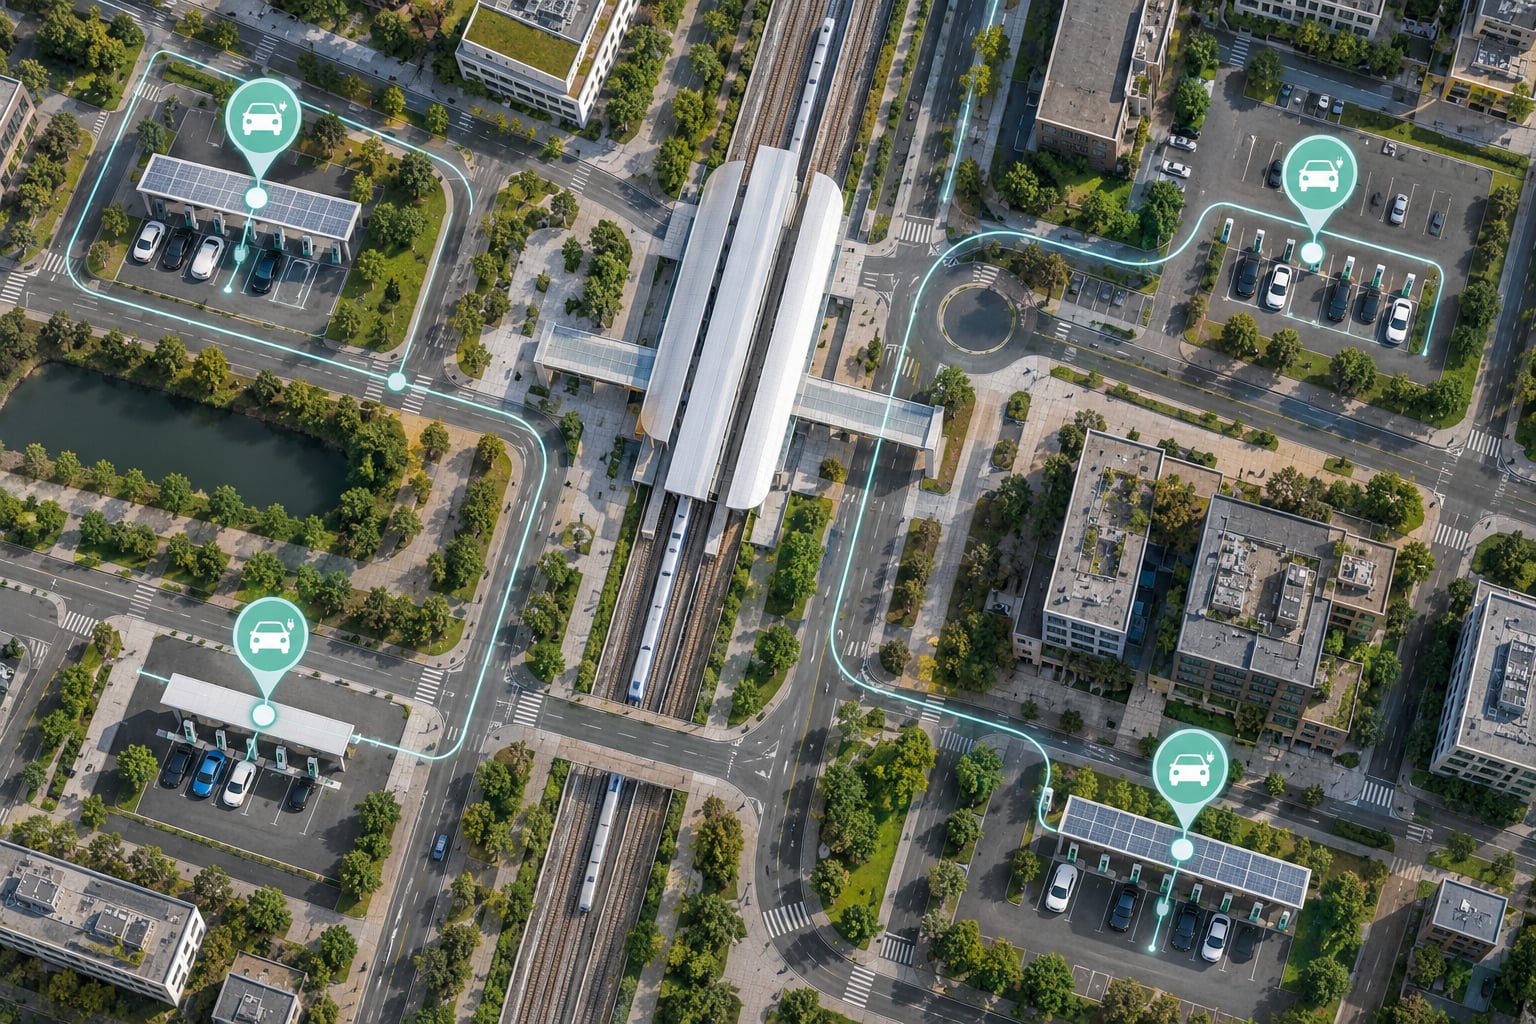
Cities plan electric vehicle charging networks in a fixed order: forecast adoption and trip demand, model siting and charger mix, confirm electrical capacity with the distribution utility, secure permits and funding, then build, energize, and operate against published utilization and uptime targets. Nobody picks a parking lot at random, and the same sequence holds whether the project is four curbside posts or a two-megawatt depot.
I’ve read enough city charging plans and utility interconnection studies to know where the process usually breaks. The forecasts are fine. The failure is almost always a stage that got skipped: capacity confirmed before site control, permits assumed instead of scheduled, or a network designed around charger counts rather than how long cars actually sit still.
Here is how the work breaks down, stage by stage, with the people who own it and how long it usually takes.
Table of Contents
- How Electric Vehicle Charging Networks Are Planned
- What Data Do Planners Use to Forecast Charging Demand?
- Jargon you will meet in every plan document
- How Do Planners Choose Charging Locations?
- How Many Chargers Does a City Need?
- How Does the Electric Grid Affect Network Planning?
- What Charging Speeds and Connector Types Should Be Supported?
- How Do Planners Make Charging Networks Equitable and Accessible?
- How Do Cities Phase Construction and Track Performance?
- Frequently Asked Questions
- How do cities decide where to put electric vehicle charging stations?
- How many public EV chargers does a city need?
- Do all EV charging stations need major electrical grid upgrades?
- What is the difference between Level 2 and DC fast charging?
- Should EV charging stations be installed in residential neighborhoods?
- How do cities measure whether an EV charging network is successful?
- Conclusion
How Electric Vehicle Charging Networks Are Planned
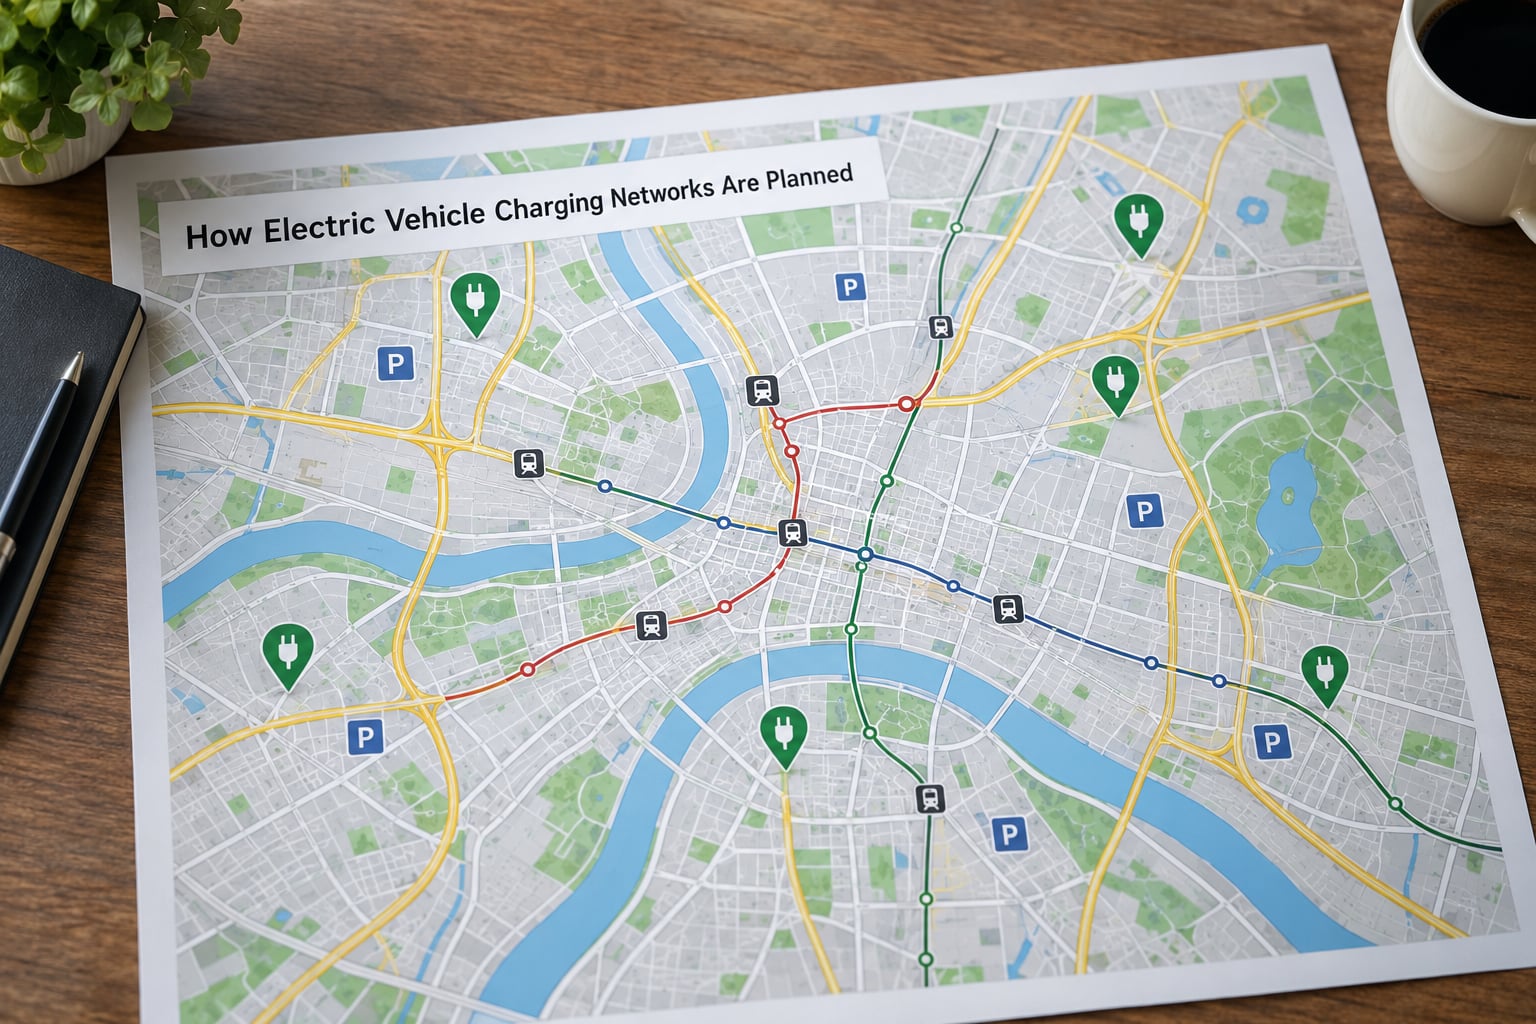
Electric vehicle charging networks are planned by modeling where electrified vehicles will live, work, park, and queue, then matching charger locations and power levels to that behavior, confirming capacity with the local distribution utility through a formal interconnection application, and building against measurable service targets.
The seven-stage framework below is the spine almost every mature plan follows. Stage one through three are analysis. Stages four and five are the ones with external dependencies, and they are where schedules slip.
- Define the service area and goals. Pick the boundary (city, county, corridor, transit agency) and write down the outcomes in advance.
- Forecast adoption and charging demand. Project vehicle registrations and translate them into charging sessions by place and hour.
- Run siting and sizing. Rank candidate locations, decide Level 2 versus DC fast charging, and count ports.
- Secure host sites. Get letters of intent or leases before spending engineering money.
- Run grid interconnection and energization. Submit the application, complete the load study, build any upgrades, energize.
- Permit, fund, and construct. Work the authority having jurisdiction and stack grants, rebates, and credits.
- Operate, measure, and expand. Track utilization, uptime, and queue length, then decide where the next tranche goes.
A stage table is more useful than the list alone, because it shows who is holding the schedule at any moment.
| Stage | Primary owner | Typical duration | Key deliverable |
|---|---|---|---|
| Service area and goals | Municipality or agency | Weeks | Scope memo with measurable targets |
| Demand forecast and gap analysis | Planning consultant or in-house analyst | 1 to 3 months | Demand model and coverage map |
| Siting and sizing | Planner with host sites | 1 to 3 months | Ranked site list with port counts and charger mix |
| Host site control | Property owner and developer | 1 to 6 months | Executed lease or letter of intent |
| Utility interconnection | Distribution utility | Weeks to a year | Approved energization date |
| Permitting | Authority having jurisdiction | Weeks to months | Issued electrical and construction permits |
| Construction and commissioning | Electrician and equipment installer | 2 to 9 months | Tested, metering-connected, live chargers |
| Operations and expansion | Charge point operator | Ongoing | Monthly utilization and uptime reporting |
The interconnection row has the widest spread in practice. Utility practitioners have described SDG&E energization running six to twelve weeks for straightforward work, while PG&E timelines run three to six months in the best case and stretch considerably when upgrades or complications enter the picture. Plan for the long end, not the short one.
What Data Do Planners Use to Forecast Charging Demand?
Demand forecasting combines vehicle projections, trip behavior, and land use to estimate where, when, and how much charging a place will need.
The backbone input is the registration count for the service area, split by vehicle class. Passenger EVs, delivery vans, transit buses, and heavy-duty trucks do not behave the same way. A passenger car that arrives at work at 9 a.m. and leaves at 5 p.m. can charge all day. A transit bus that runs a 12-hour route needs its whole window managed deliberately.
Planners layer five more things on top:
- Trip origins and destinations. Commute flows tell you where overnight charging should go; retail and hospitality trips point to destination charging.
- Dwell time. Parking duration decides whether a site can support Level 2, DC fast, or nothing at all. Ten minutes of curb dwell cannot support a fast-charge stop.
- Land use and future development. Approved housing and commercial projects change the demand picture before a single vehicle arrives.
- Existing charger inventory and its performance. Counts alone mislead. A site with six dead connectors subtracts from supply more than it adds.
- Utility rate and capacity data. Time-of-use windows and feeder headroom tell you when charging can actually happen.
The comparison between projected supply and projected demand is called a gap analysis. It is the single most cited artifact in state EV plans, and it is what turns a nice map into a funding argument.
One caution about registration data. Historical adoption curves undershoot when a price drop or a new model cycle hits, and they overshoot early when incentives pull sales forward. Good plans carry a low, medium, and high scenario rather than a single line.
Jargon you will meet in every plan document
Four terms cause most of the confusion in public meetings, so it is worth being precise. Interconnection is the formal process through which a host site or charging provider seeks connection to the distribution system. Energization is the moment power actually flows and chargers can be commissioned. The host site owns the land and usually the meter; the charge point operator runs the stations, the software, and the payment side. DCFC means DC fast charging. Demand charges are what a utility bills for peak demand rather than energy, and time-of-use rates price energy differently by hour. NEVI is the federal program funding interstate corridor charging, which sets minimum standards including four DC fast ports at 150 kW each, 97 percent uptime, and 24/7 public access.
How Do Planners Choose Charging Locations?
Siting starts with dwell time and ends with electrical capacity. Everything else sits in between.
The scoring criteria most city plans use rank like this:
- Dwell time first. Hours parked, not minutes. Overnight and all-day parking support Level 2. Twenty-minute retail stops and highway stops support DC fast.
- Proximity to where vehicles live and idle. Apartment parking, office garages, and municipal lots serve different vehicle populations and none of them serve everyone.
- Visibility and wayfinding. Drivers will not detour far for a charger they did not know existed.
- Accessibility compliance. Accessible stall counts, van access aisle, and curb heights are permit-level requirements, not preferences.
- Electrical proximity. Distance to the nearest transformer and available spare capacity can eliminate an otherwise perfect site.
- Traffic and vehicle throughput. A four-stall retail site next to a busy road can generate more demand than a twelve-stall lot in a quiet district.
- Coverage of underserved areas. Equity targets often override pure utilization math, which is a deliberate choice planners should state openly.
That last point is the one that gets argued about. A ranking built purely on projected utilization will push sites toward high-income, high-retail districts. A ranking built purely on need will place chargers where few cars live. Most published plans use a weighted score with an equity floor, and the weights are the political decision.
Curbside deployment deserves its own category. It uses existing kerb space and needs street signs, metered parking rules, and a maintenance agreement with the city, because a disabled post on a residential street is an outage the public will notice.
How Many Chargers Does a City Need?
Planners convert demand forecasts into ports per site, sites per district, and a network-wide ratio that is usually expressed as ports per 1,000 registered EVs.
Work from the bottom up rather than the top down. Estimate energy demand in kilowatt-hours per day for a district, divide by the usable energy delivered per port per day, and you have a port count. The usable figure depends on power level and dwell time, which is why a fast port and a slow port cannot be counted as interchangeable.
Then split that count by use case, because each one has its own rule of thumb:
| Use case | Typical power | Typical dwell | Sizing approach |
|---|---|---|---|
| Workplace and multifamily | Level 2, 7 to 19 kW | 8 to 12 hours | Ratio of stalls to enrolled employees or units |
| Destination and retail | Level 2 or 150 kW DCFC | 1 to 3 hours | Share of arriving EVs expected to charge |
| Highway corridor | 150 kW and above | 20 to 45 minutes | Ports per stall, spaced along the route |
| Fleet depot | Level 2 to megawatt-class | Overnight window | Energy required per shift divided by window length |
This is where the 80/20 idea comes in, and it comes up constantly in planning discussions. Concentration beats even coverage: a large share of charging sessions happens at a small share of locations, typically homes, workplaces, and a few high-traffic corridors. Spreading ports thinly across every neighborhood tends to produce quiet sites that are neither financially sustainable nor visible.
The practical read is that planners should aim for a smaller number of well-used sites, then protect equity coverage with a floor rather than spreading everything evenly.
How Does the Electric Grid Affect Network Planning?
The grid decides your schedule. Siting, permitting, and construction can all be fast, and a site can still sit dark for months waiting on capacity.
The sequence starts with an interconnection application to the distribution utility, usually accompanied by a single-line diagram and a load study showing expected concurrent demand in kilowatts. The utility then tells you what it can serve and what has to change. Typical upgrades include a larger service, a new transformer, switchgear, meter changes, and conduit or trenching back to the utility side of the property line.
Four planning decisions come out of that conversation. How much spare capacity to build for on day one. Whether to add dynamic load management so ports share a fixed power envelope rather than each drawing full output. Whether on-site battery storage buffers peak demand to avoid a service upgrade. And whether managed charging or vehicle-to-grid capability is worth designing in now, since retrofitting smart charging later usually means new hardware and software.
Utility practitioners have pushed for something simple for years: standard specifications, a published flowchart, and one named point of contact. The recurring complaint is that unprepared site changes, such as relocating a charger to meet an accessible-parking rule, send a project back to the start of the review.
On the operations side, the electricity bill is not just an energy bill. Demand charges hit a site with a short, sharp peak, so unmanaged fast charging at full power can cost more in one afternoon than managed charging would over a month. Time-of-use scheduling is the cheapest load management tool available, and it needs no new hardware beyond the control software the operator already runs.
What Charging Speeds and Connector Types Should Be Supported?
Match the power level to how long the vehicle sits. Everything else follows from that one rule.
Level 2 charging runs between roughly 7 and 19 kW and adds meaningful range over a working day. DC fast charging starts at 50 kW and goes well past 150 kW for corridor sites, with higher-power designs appearing on new routes. Ultra-fast designs push toward full refuel-equivalent times for passenger vehicles, and they pull far more power per site, which pushes harder on the same feeder.
On connectors, planners increasingly specify both dominant formats at highway and public sites so no driver has to guess. North American sites use the CCS combo format and the NACS format, and fleet procurement often still runs CCS. Buying one type only is cheaper up front and creates a coverage complaint later.
Interoperability has two layers. OCPP handles the charger-to-operator conversation for monitoring and control. OCPI handles operator-to-network and operator-to-platform, which is what lets a city app, a map, or a routing service show live status instead of a stale icon. Publishing those feeds costs nothing and removes an entire category of user frustration.
That last point matters more than the hardware spec. Drivers report arriving at low state of charge and finding no working connector, and they navigate around exactly that risk by trusting operator status pages and community outage lists over marketing claims. A network that broadcasts accurate availability is worth more to the public than a network with three more stalls.
How Do Planners Make Charging Networks Equitable and Accessible?
Equity is treated as a design constraint with a numeric target, not as a nice add-on after siting is finished.
In practice that means several things. Rentalers and people in multi-unit buildings need a path to charge that does not require owning a dedicated stall, usually a shared garage solution with load sharing. Rural, tribal, and low-income areas get coverage commitments even when the demand model does not justify them on utilization alone. Disability access is checked at design time against applicable parking standards. Languages served follow the community being served rather than a default English-only app.
Pricing needs attention too. Drivers point out that curbside units frequently cost more than destination charging at a nearby lot with more room. A network can meet a coverage target and still fail people if the pricing structure pushes them to wait for a cheaper site three miles away.
The anti-pattern to avoid is the single-metric approach. Reporting chargers added per quarter looks productive and can be satisfied entirely in the easiest district. Equity targets are better written as geographic and demographic commitments with named neighborhoods.
How Do Cities Phase Construction and Track Performance?
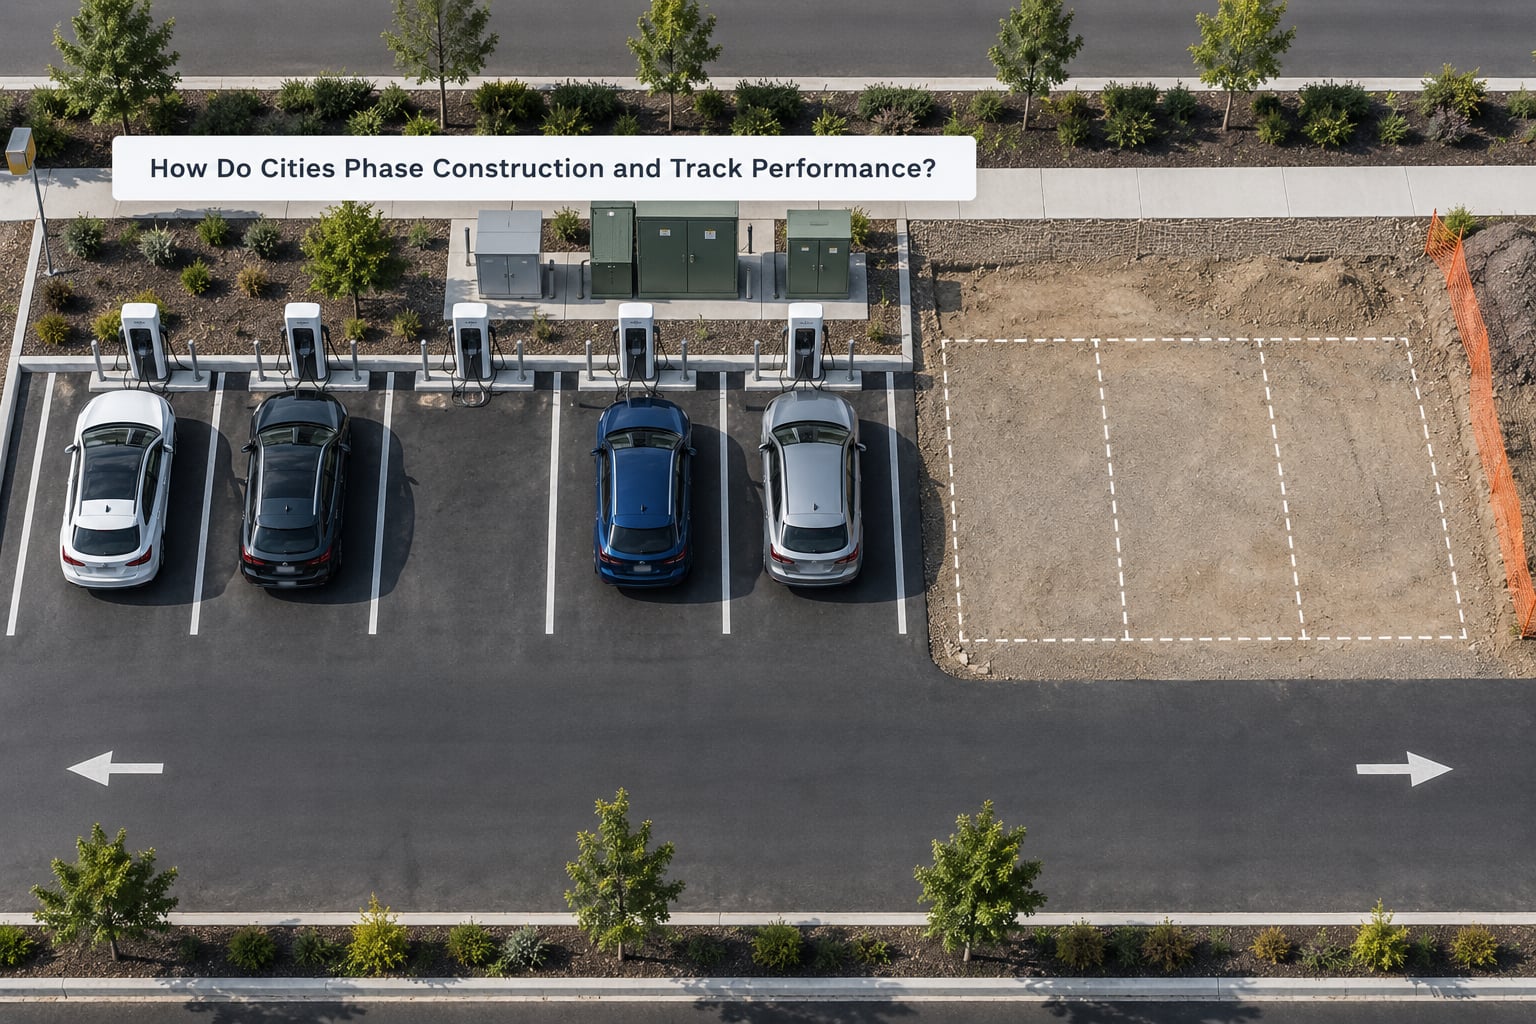
Cities build in tranches sized to what they can operate, then measure before committing the next one.
A workable sequence starts with a first phase at sites with known capacity and clear host agreements, delivers those sites to a published uptime target, and uses the operating data to set the next phase. Conduit and space are often installed ahead of the chargers themselves, so an expansion is a matter of adding equipment rather than running new trench.
Permitting runs in parallel with interconnection rather than after it. Both are external queues, and both benefit from a named project manager on each side.
Workforce is the constraint that gets underestimated. Electricians who can terminate and commission high-power chargers are a limited pool, and a plan that schedules ten sites in one quarter will find installers unavailable. Staggering the schedule matters more than adding dollars.
The metrics dashboard should carry at least five numbers: utilization per port, uptime, ports per 1,000 registered EVs, queue length or wait time during peaks, and uptime of the data feed itself. Those numbers decide expansion. A site at high utilization with a queue becomes a candidate for more ports; a site at low utilization after two years becomes a candidate for a different power level or relocation.
Reliability gets planned, not hoped for. That means spare port ratios, a maintenance service level, and a defined replacement cycle for failed units. It also means the reporting is honest, because drivers already know the difference between a charger that is listed as available and one that actually works.
Frequently Asked Questions
How do cities decide where to put electric vehicle charging stations?
Cities score candidate sites against a short list of criteria: how long drivers park there, how close it is to where vehicles live and idle, whether the site is visible and easy to reach, accessibility compliance, available electrical capacity near the nearest transformer, and whether the location covers an underserved neighborhood. Dwell time usually carries the most weight, because a site where cars sit for hours can support slower charging while a ten-minute curb stop cannot. Equity requirements often set a floor under the ranking so investment does not concentrate in one district.
How many public EV chargers does a city need?
There is no single number, so planners work from the bottom up. They estimate daily charging energy for a district, divide it by the usable energy a port delivers during its dwell time, and then split the result across use cases. Workplace and multifamily charging relies on overnight dwell, destination charging on one to three hours, and highway corridor sites on short stops with high power. Most plans also track a network-wide ratio of ports per 1,000 registered EVs as a progress marker.
Do all EV charging stations need major electrical grid upgrades?
No. Many sites connect to existing spare capacity, especially Level 2 stations in parking garages and lots that already have substantial service. Fast charging sites are more likely to trigger work, because a single 150 kW port can exceed what an older service was built for. Even there, dynamic load management, time-of-use scheduling, or an on-site battery can reduce or avoid a service upgrade. The utility confirms this during the interconnection application and load study.
What is the difference between Level 2 and DC fast charging?
Level 2 charging runs on the same 240 volt supply a dryer uses, delivering roughly 7 to 19 kW, and typically adds 20 to 40 miles of range per hour. DC fast charging delivers direct current at 50 kW and well above, adding hundreds of miles in under an hour. Level 2 suits parking lasting several hours, while DC fast serves corridor trips and short retail stops. Higher power also means a harder pull on the electrical service, which is why fast sites face longer interconnection timelines.
Should EV charging stations be installed in residential neighborhoods?
Often yes, but as curbside or shared solutions rather than private stalls. Neighborhoods with apartment buildings, rental housing, and long-term street parking have high overnight demand and few alternatives. Curbside posts need metered parking rules, signage, and a maintenance agreement with the city, since a broken unit on a residential street is highly visible. Public housing and multi-unit buildings usually work better with a shared garage system using load sharing across many vehicles than with individual home chargers.
How do cities measure whether an EV charging network is successful?
Planners track utilization per port, charger uptime, ports per 1,000 registered EVs, peak queue length or wait time, and the health of the real-time availability data feed. Counts of chargers installed are treated as an input rather than a success measure, because a site can have many ports and still be quiet. Uptime is commonly held to a 97 percent standard under federal NEVI rules, and utilization data determines whether the next phase adds ports at busy sites, relocates quiet ones, or changes the power level offered.
Conclusion
Start with the sequence, not the site list. Define the service area and the goals you will be judged on, build a demand model and a gap analysis, rank sites on dwell time and electrical proximity, then lock down host sites before spending on engineering.
After that, treat the utility, the authority having jurisdiction, and the installer as part of the plan rather than as approvals you will collect later. Each of the seven stages has an owner and a deliverable, and the plan should say who holds the schedule at any moment.
The role split is worth repeating because it gets confused constantly. The utility sets capacity and energization. The municipality defines equity and street rules. The host site provides land and often the meter. The charge point operator runs the network, the software, and the maintenance. The developer or agency funds and builds. Networks that skip any of those handoffs are the ones that stall.
As vehicle counts climb through 2026 and into the next decade, the planning questions stay the same in shape but get sharper: less about where to put chargers and more about keeping them working, accurately advertised, and fairly distributed.