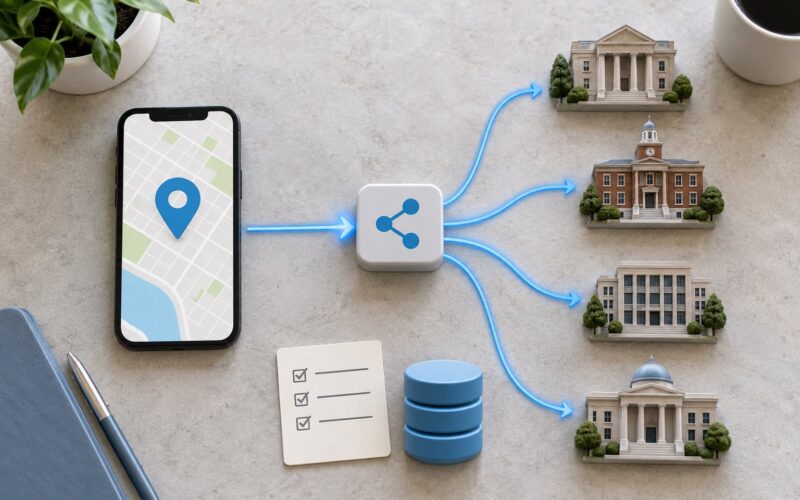
To learn SQL for working with public data, you need three things and nothing else: a SQL engine that runs in your browser, one real government or civic dataset, and a short list of queries to work through. The loop is always the same — find a dataset, load it, query it, answer a question — and every step below fits inside a first sitting. Most people who struggle with SQL are not bad at math; they are practising on tidy toy tables like Northwind instead of the messy real files that public data actually ships.
That is the whole difference. A toy dataset has clean categories and one date format. A 311 service-request file has three date formats, empty ZIP codes, and the same category spelled four ways. Learn on the messy stuff early and the tidy stuff stops being interesting at all.
Table of Contents
- What You Need Before You Start
- Step-by-Step: Learn SQL With Public Data
- 1. Learn the SQL Basics
- 2. Choose and Inspect a Public Dataset
- 3. Set Up a SQL Workspace for Working With Public Data
- 4. Write Your First SELECT Queries
- 5. Group and Summarize Public Data
- 6. Join Related Tables
- 7. Check and Interpret Your Results
- 8. Build a Small Public-Data Project
- Common Mistakes When You Learn SQL for Working With Public Data
- Frequently Asked Questions
- Is SQL difficult to learn for beginners?
- Which SQL dialect should I learn for public data?
- What public-data format should beginners use?
- Can I practice SQL without installing a database?
- Can I learn SQL in 2 weeks?
- How do I move from exercises to real public-data projects?
- Conclusion
What You Need Before You Start
You do not need a server, a credit card, or any installation. Here is the full list of what actually matters.
- A computer and a browser. Anything you can open Chrome or Firefox on works. A ten-year-old laptop is plenty, because the datasets below run in a web page or a single file.
- A SQL workspace. For the zero-install route, DuckDB in your browser (the DuckDB Web Shell) or BigQuery in the Google Cloud console both work. SQLite through DB Browser for SQLite is the good offline option once you outgrow the browser.
- One public dataset. Pick something with a question attached to it. A 311 service-request log for your own city beats a global temperature series, because you already know what a pothole report is.
- A place to keep your queries. A plain text file is fine, or a notebook if you already use one. Query history is where the learning lives — you will want to see the version that returned nonsense next to the version that worked.
If you want a second pair of eyes on anything, the smart city and open data work we publish sits alongside this guide.
Step-by-Step: Learn SQL With Public Data
1. Learn the SQL Basics
SQL is a declarative language: you describe the shape of the answer and the engine figures out how to get it. Everything in this article builds on five nouns — the database, the table, the row, the column and the key.
A table looks like a spreadsheet with rules. Columns have names and data types, rows are individual records, and a primary key is the column that uniquely identifies a row. Almost every government dataset gives you one, usually called an id, and it is what you join on later.
SELECT district, COUNT(*) AS requests
FROM service_requests
GROUP BY district
ORDER BY requests DESC;
Read it out loud: show me the district and a count of requests, grouped by district, biggest first. Six keywords, one answer.
2. Choose and Inspect a Public Dataset
Start with the documentation, not the file. Every serious public portal ships a data dictionary that tells you what each column means, how often it is refreshed and what the licence allows. Skip that page and you will spend an afternoon answering a question the documentation already answered.
| Source | What it holds | Scale | Refresh | How you query it |
|---|---|---|---|---|
| Catalog.data.gov | Index of federal datasets across every agency | Catalogue of hundreds of thousands of records | Varies by agency | Download or push the file to a workspace |
| City Socrata portals | 311 calls, permits, inspections, budgets | Thousands to millions of rows | Nightly or live | Built-in web query editor or SODA API |
| census.gov | Decennial and American Community Survey tables | Tens of thousands of rows per table | Every year plus five-year estimates | Download, or API |
| Open311 | Aggregated service-request records by city | Hundreds of thousands of rows | Daily | Standard export, often CSV |
| GTFS feeds | Transit stops, routes, schedules | Thousands of rows | Whenever the agency updates | Static CSV files |
| BigQuery public datasets | Weather, mobility, census, GitHub traffic | Very large | Varies | SQL directly in the console |
| Google Dataset Search | Cross-site index of published data files | Metadata only | Continuous | Points you at the source |
Before loading anything, check four things in a text editor: the delimiter, the header row, the date format and the licence. Then run one inspection query before you run any analysis.
SELECT COUNT(*) AS rows,
       COUNT(request_id) AS ids_present,
       MIN(created_at) AS earliest,
       MAX(created_at) AS latest
FROM service_requests;
If the id count is lower than the row count, you have duplicates. If the date range stops two years short of the last refresh, something is being filtered on import. This query takes ten seconds and tells you more than an hour of guessing.
3. Set Up a SQL Workspace for Working With Public Data
For a first run, open DuckDB in the browser and point it at the CSV file. DuckDB reads files directly, so there is no database to create, no schema to design and no load step to get wrong. In BigQuery the public datasets are already loaded, so you can skip straight to querying.
Once you want to keep the file, run DuckDB or SQLite locally. DuckDB handles columnar scans and big files well; SQLite is the friendlier choice if you later want to write a small app on top. Either way, the SQL you write is nearly identical.
4. Write Your First SELECT Queries
Start flat. Pull a handful of rows, look at them, then filter. Seeing the raw data before you aggregate it is the habit that saves you from a confidently wrong answer.
SELECT *
FROM service_requests
LIMIT 10;
Then ask one narrow question. How many requests did each district log in the busiest month?
SELECT district,
       COUNT(*) AS requests
FROM service_requests
WHERE status = 'Closed'
  AND created_at >= '2026-01-01'
GROUP BY district
ORDER BY requests DESC
LIMIT 10;
LIMIT 10 while you explore and 10,000 when you export. It is the cheapest performance habit in SQL.
5. Group and Summarize Public Data
GROUP BY collapses many rows into one row per group. Wrap it in COUNT, SUM or AVG to get a number. Alias the result with AS so you can reference it in ORDER BY, which is not allowed to use a column name you invented in the same SELECT.
SELECT category,
       COUNT(*) AS total,
       AVG(EXTRACT(DAY FROM closed_at - created_at)) AS avg_days_to_close
FROM service_requests
GROUP BY category
HAVING COUNT(*) > 50
ORDER BY avg_days_to_close DESC;
HAVING is the filter that runs after grouping. Filter single rows with WHERE and filter groups with HAVING — that one distinction resolves a surprising number of beginner errors.
6. Join Related Tables
Most civic questions need two files. Building permits are almost useless alone; add parcel or census-tract geography and you can ask about density. This is the step that separates a course completer from someone who can be hired.
SELECT p.neighborhood,
       COUNT(*) AS permits,
       AVG(p.estimated_cost) AS avg_cost
FROM permits p
JOIN parcels q ON q.parcel_id = p.parcel_id
GROUP BY p.neighborhood
ORDER BY avg_cost DESC;
An INNER JOIN keeps only rows that match on both sides. When you need every row from the first table even when the match is missing, switch to a LEFT JOIN — and then check how many matches were missing, because that count is usually the interesting finding.
SELECT COUNT(*) AS unmatched_permits
FROM permits p
LEFT JOIN parcels q ON q.parcel_id = p.parcel_id
WHERE q.parcel_id IS NULL;
That second query is a genuine result on its own. If it returns thousands of rows, your join key does not match the way you assumed and every number from the first query is wrong.
7. Check and Interpret Your Results
Three checks catch nearly every bad result. Confirm the row count is what you expect, sample ten rows by hand, and read the documentation line that defines the units.
Public agencies change definitions mid-stream, and they rarely update the old file. A column called closed may have meant something different two releases ago. When a trend looks dramatic, the first thing to check is whether the definition changed, not whether the city got better.
Write the caveat next to the number, not in a footnote. A number without its unit and time window is not a finding.
8. Build a Small Public-Data Project
Pick one question you actually care about, one dataset, and one join. Write the queries in order, save each one with a comment explaining what it answers, and export the final result as CSV or GeoJSON.
Then publish it: a short write-up, the source URLs, the date you pulled the data, and the two or three things the data cannot tell you. Projects like this read as competence, because they show judgement about limitations, which is what reviewers look for.
Mapping results to points and loading them into a map viewer is the fastest route from a query to something a non-technical person can look at.
Common Mistakes When You Learn SQL for Working With Public Data
| What goes wrong | Why it happens | The fix |
|---|---|---|
| Missing semicolon at the end | The editor runs everything, not just the highlighted block | Highlight the query, or end every statement with a semicolon |
| Error on a column called order or date | Reserved word used as an identifier | Wrap it: “order”, or rename on import |
| Only the first result row comes back | A comma after the last column | Trailing commas create an empty column and change the result shape |
| Totals that are all zero | NULL values are skipped by SUM and COUNT of a column | Use COALESCE, or COUNT(*) to count rows including empty ones |
| Row count triples after a join | Many-to-many match on a non-unique key | Check for duplicate keys before joining, or aggregate first |
| Dates sorting alphabetically | Stored as text in a non-ISO format | Load as a date type, or parse with a known pattern |
| Categories split into four groups | Inconsistent casing and spelling across agencies | Normalise with UPPER and TRIM, then group on the cleaned column |
| Dates landing on the wrong day | Ambiguous formats such as 03/04/25 | Use unambiguous dates in YYYY-MM-DD and check the max value |
Two more worth internalizing. Duplicate IDs are normal in public data — agencies re-export rows without changing them — so deduplicate before you count anything. And an empty cell is not the same as zero; a missing complaint count does not mean zero complaints happened.
The community habit that works: learn the syntax on a tutorial platform, then apply it to a real public dataset the same week, then publish what you find. That loop is what keeps people going past the boring exercises.
Frequently Asked Questions
Is SQL difficult to learn for beginners?
SQL is one of the more approachable languages because its core syntax is repetitive and maps to plain operations: picking rows, filtering records, sorting results and grouping numbers. If you can write a formula in a spreadsheet, you can write a SELECT statement. The hard part for most people is not the syntax but staying with messy real data long enough to build judgement about it.
Which SQL dialect should I learn for public data?
Learn standard SQL first, because SELECT, WHERE, GROUP BY, JOIN and aggregation read the same almost everywhere. Once the fundamentals are automatic, learn the dialect your chosen workspace uses. BigQuery uses standard SQL with some Google-specific functions, DuckDB and SQLite are close to Postgres, and Socrata portals use a Postgres-like flavour. One dialect well beats four half-learned.
What public-data format should beginners use?
Start with CSV. Spreadsheet tools, text editors and every SQL engine read it, and you can inspect it before loading anything, which makes bad data obvious early. Move to GeoJSON when location matters, since most engines read it as points on a map. Parquet is worth learning later for large files, but it is opaque in a text editor and a poor first choice.
Can I practice SQL without installing a database?
Yes, and you should start that way. BigQuery exposes public datasets that you query directly in the browser console, and DuckDB has a web shell that reads a CSV file without a server. Hosted notebooks work too. Installing SQLite or DuckDB locally takes a few minutes and is worth doing once you are writing queries that take longer than a few seconds.
Can I learn SQL in 2 weeks?
You can learn the working basics in two weeks of consistent evenings, roughly an hour a day. Days one to three cover SELECT, WHERE, ORDER BY, LIMIT and COUNT on a real civic dataset. Days four to six add GROUP BY and aggregation. Days seven to nine cover JOIN. The second week goes entirely to one small project of your own. Joins are where people stall, so give them two full days rather than one.
How do I move from exercises to real public-data projects?
Stop solving exercises you did not invent the question for. Pick a dataset about something you already care about, write down one question in plain English, and use SQL only to answer it. The exercises taught you the verbs; the project teaches you which noun you actually wanted. Publishing the write-up is what converts practice time into something you can show.
Conclusion
Learning SQL for working with public data is a short path once you stop practising on the wrong data. Learn the six keywords, load one messy civic file, group it, join it once, check the result, and write down what the numbers cannot tell you.
Do this next: pick a 311 or permits dataset for your own city, open it in a browser SQL workspace, and run one SELECT with a COUNT. That first answer takes about fifteen minutes and it is the moment the language stops being abstract.