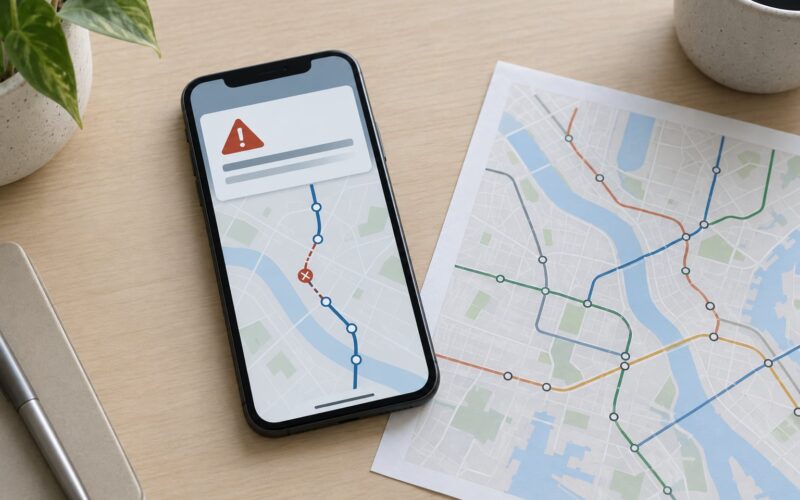
Users uninstall apps in the first week because friction arrives before value. A slow first launch, a signup wall, a permission prompt that means nothing yet, or an ad before the first useful screen all push the user into a cost-versus-benefit verdict inside the first minute, and deleting is the easiest way out. Roughly a quarter of users abandon an app after a single use, so this window decides whether an install ever becomes a retained user.
The useful part of this topic is not the list of reasons everyone publishes. It is the distinction between what the app did, what the operating system did, and what the user was silently hoping for, because each one needs a different fix and a different way of measuring it.
Table of Contents
- Why Users Uninstall Apps in the First Week
- What Early App Behavior Reveals
- What early behavior reveals about why users uninstall apps in the first week
- Common Reasons for First-Week Uninstalls
- How Onboarding Can Encourage or Discourage Retention
- How to Diagnose the Problem Behind an Uninstall
- What Product Fixes Reduce Early Uninstalls?
- How App Teams Should Measure First-Week Retention
- Frequently Asked Questions
- What percentage of users uninstall an app in its first week?
- Is a long onboarding flow always bad for retention?
- Should an app ask for permissions before showing its core value?
- What is the difference between day-one and day-seven retention?
- How can a small app team find out why users uninstall?
- Conclusion
Why Users Uninstall Apps in the First Week
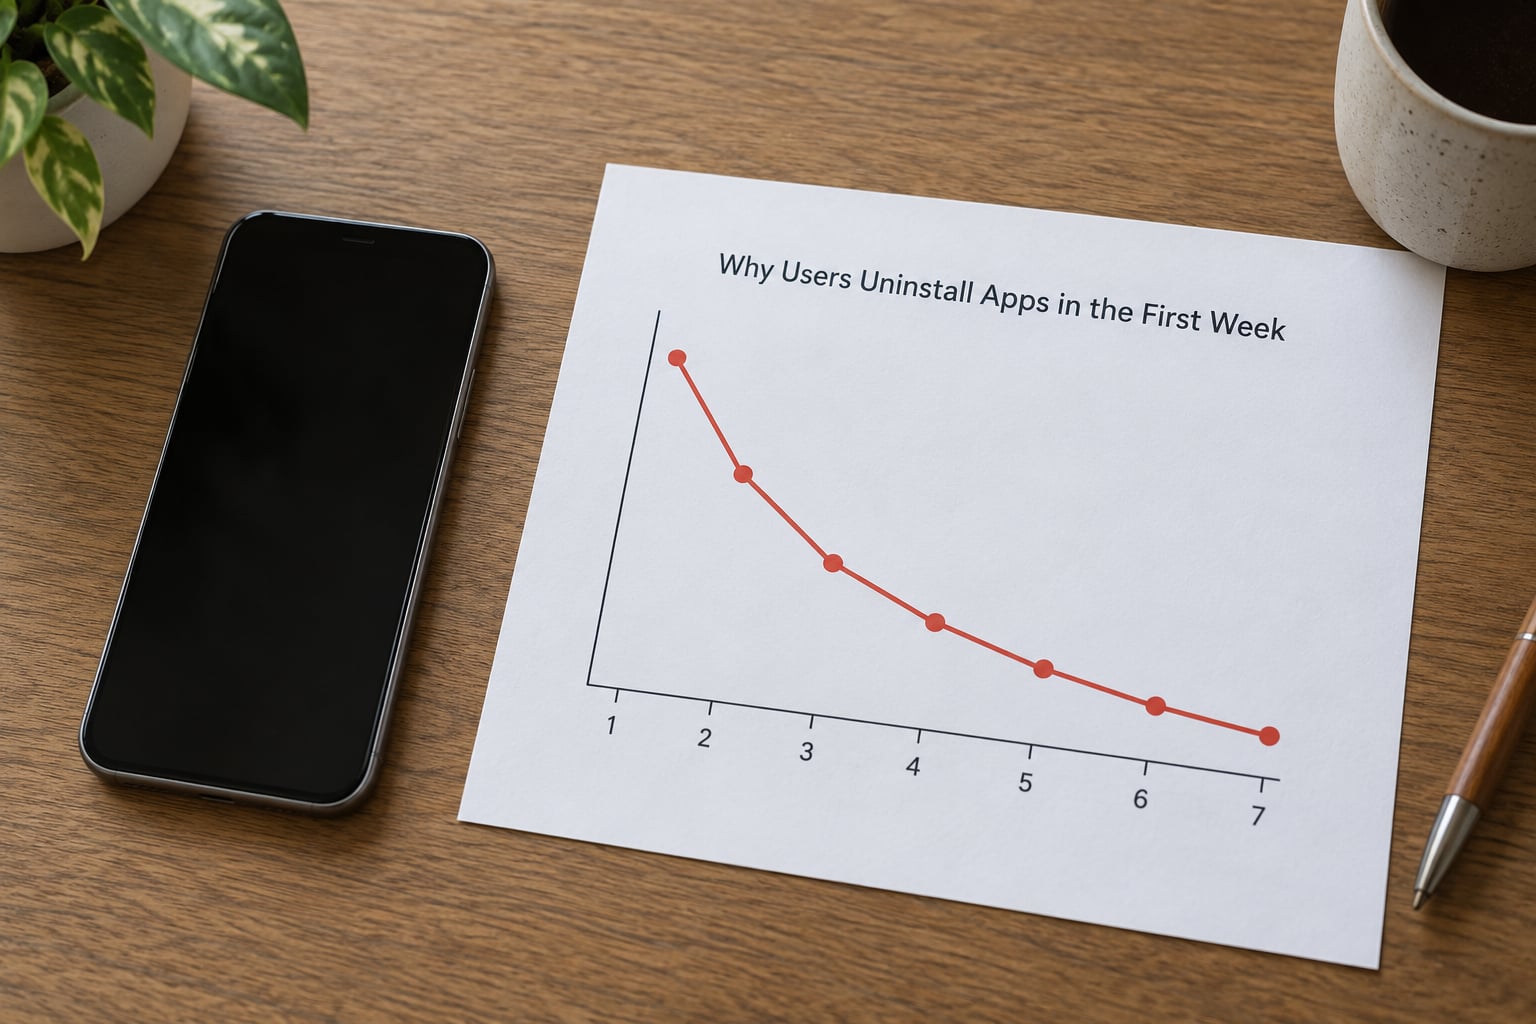
First-week uninstall churn is the share of new installs that are deleted within seven days of download, before a habit forms and before there is any reason to come back. Three separate things hide inside that number, and treating them as one is the most common mistake teams make.
The first is deliberate abandonment. The user installed, thought about a use for the app, and found that the app did not meet it. This is a product problem and it is fixable.
The second is friction-driven abandonment. The user had a reason to install, hit a wall (signup, paywall, an error, a freeze), and left without forming a view about the product at all. Nothing about the app was wrong. The path was wrong.
The third is system-initiated removal. On Android, OEM battery managers, storage-reclamation tools, and enterprise mobility policies remove apps that the user never consciously chose to delete. On iOS, offloading and storage pressure can strip apps down to a stub. Owners usually do not account for this in churn math, so their real numbers look better than the user experience and worse than the report.
Timing is the other clue. Most of the week-one drop happens on day zero and day one, immediately after install. A second, smaller drop lands around day three, when the user has had a session or two but no reason to expect the next one. Whatever happens after day seven is a different conversation: habit, seasonality, or genuine product failure.
One more framing matters. People quit out of apathy, not anger. Uninstalling is a low-effort, low-emotion action with no friction and no social cost, so the user does not write a support ticket or leave a one-star review. Your analytics sees the disappearance without ever seeing the reason, and the churn survey you send three weeks later answers a question the user has already stopped caring about.
What Early App Behavior Reveals
The install-to-first-action funnel is where the answer lives. Every early signal below points at a specific step, and reading them together usually identifies the cause within an afternoon.
| First-week signal | What it usually points to | Where to look |
|---|---|---|
| Install, then no session at all | Accidental or low-intent install, or a broken first launch | Session records by campaign and device |
| Session recorded, first action never fires | Empty states, unclear navigation, or an empty account | Event stream for the top three screens |
| Signup started, never finished | Too many fields, no social login, verification friction | Signup funnel step by step |
| Onboarding started, exited before the last step | Tutorial length, cognitive load, no skip option | Step-by-step onboarding completion |
| Permission denied at first prompt | Permission asked before its purpose was clear | Permission request-to-grant conversion |
| Search or filter returns nothing | Cold start with no inventory, no location, no history | Query logs and zero-result rate |
| Several short sessions, no second-day return | Nothing worth scheduling a return for | Day-one retention by cohort |
| Session spikes followed by long gaps | Notifications and ads tuned for volume, not tolerance | Notification opt-out and ad-interaction rates |
| Crash-free rate looks healthy, retention still falls | Freezes, latency, and third-party API delays | ANR and freeze rates, cold start time |
| Installs drop without any funnel change | System-initiated removal by OEM policy or MDM | Cohorts by device model, carrier, and managed/unmanaged flag |
What early behavior reveals about why users uninstall apps in the first week
The path from install to first meaningful outcome is diagnostic, not just measurable. When that path is short and the outcome arrives inside the first session, week-one retention is usually fine, whatever the app’s category. When the path is long, the exit sits at whichever step asked for the most effort before the user had a reason to give it.
That is why three questions explain most early churn. Did the app confirm why it is useful? Did it demand more input than the value it had already delivered? Did it ask for trust before it earned any?
A useful diagnostic sequence from teams on r/AppBusiness is to segment new users by acquisition source and device first, then walk the funnel for each segment rather than for the blended average. Blended week-one retention usually hides the cause, because the drop from one paid channel gets averaged against a healthier organic cohort.
Practitioners in r/MobileAppDevelopers put it more bluntly in forum threads: instrumentation of the first session tells you more than interviews do. Session recordings and drop-off points show you the exact screen where the exit happened, which is the thing a user will never describe accurately in a survey two weeks later.
Common Reasons for First-Week Uninstalls
Eight causes cover most of what I see in week-one cohorts, roughly in order of how often they turn out to be responsible.
- Low perceived value in the first session. The install came from an ad, a search result, or a friend’s recommendation, and the app opened on a login wall, a carousel of tips, or an empty feed. Nothing confirmed the reason the user installed. Example: a transit app that opens with a mandatory account creation form before showing a single route or arrival time.
- Onboarding friction. Signup with six fields, no social login, email verification before anything useful, and a five-screen tutorial. Example: a food-delivery app where the user must confirm a payment method before seeing any restaurant.
- Confusing navigation and empty states. The app loaded, and then nothing happened. Search returned nothing, the map had no pins, the list had no items because the account was new. Example: a secondhand marketplace app whose home screen is a map with nothing on it until you have location history.
- Notification overload. Push configured for volume rather than usefulness, firing daily for reasons the user never agreed to. Example: a banking app sending four pushes a day about account activity the user did not initiate.
- Ad pressure before value. Interstitials and rewarded-video prompts placed before or during the first useful task. Example: an article app that shows a full-screen ad between the tap and the first paragraph.
- Permission pressure at the wrong moment. Camera, location, contacts, and notifications requested on first launch with no context, which reads as data collection rather than a feature. Example: a recipe app asking for precise location before it has shown a single recipe.
- Technical instability. Slow cold start, freezes, and third-party API delays that never throw an exception and therefore never show up as crashes. Example: a weather app whose screen loads fine but whose forecast never appears because the upstream API is timing out.
- No reason to come back. The session worked, but there was no second reason to open the app. The user needed it once, got what they needed, and correctly concluded the app had served its purpose. Example: a one-off tax document app used for a single filing and never reopened.
That last one is not always a failure. Some categories are designed around it, which matters for how you read your own numbers later.
How Onboarding Can Encourage or Discourage Retention
Onboarding is where most teams decide, deliberately or by default, whether the first session proves value or extracts it. The pattern that hurts retention is consistent: ask for everything up front, prove nothing first.
Compare the two approaches. The discouraging version opens with account creation, then a permission sweep, then personalization questions about interests and goals, then a five-step tutorial, and finally the feature the user actually installed for. Every step is individually defensible and collectively fatal.
The encouraging version does less. It delivers one meaningful outcome first, then asks. In a parking app, that outcome is finding your car. In a civic services app, it is checking a permit status or a collection date. In a reading app, it is one article that loads instantly with no account at all.
Four specific moves separate them:
- Value before signup. Let people do the one thing they came for without an account. Ask for identity when it becomes necessary, not as a toll gate.
- Progressive profiling. Ask for preferences only when a choice would change what the app does next. Each question should be answerable with one tap.
- Permission with context. One sentence explaining what the permission unlocks, immediately before the request, at the moment the feature is used. Example: “Allow location to show the nearest charging station” beats a bare system prompt on first launch.
- A skip button that works. Not every user wants the tour, and hiding the skip teaches people that your flows cannot be trusted.
How to Diagnose the Problem Behind an Uninstall
Run this sequence before you change anything, because most teams end up fixing the wrong cause.
- Segment new users by acquisition source. Paid social, app-store browse, search, and referral behave differently. The paid cohort that collapses tells you the store promise and the app disagree.
- Segment by device and OS version. A drop concentrated on one OEM or one OS version points at performance or an OS behavior, not at your product decisions.
- Walk the funnel for the worst segment only. Install, first open, signup start, signup complete, onboarding complete, first meaningful action, day-one return, day-seven return. The biggest single drop is your suspect.
- Watch session recordings for that step. You are looking for hesitation, back navigation, repeated taps on dead controls, and error states nobody logged.
- Compare retained and churned cohorts. What did day-seven users do in their first session that day-one-only users did not? That difference is usually a behavior you can design for.
- Test whether the friction precedes the uninstall. Correlation is not enough. A/B test the fix on the segment that dropped and watch day-seven retention, not just the step completion rate.
What Product Fixes Reduce Early Uninstalls?
Fix the causes in the order they cost you users, not the order they are easiest to ship.
Set expectations before install. If the store listing promises something the first session does not deliver, you bought installs you were always going to lose. Match the screenshot, the promise, and the first screen. For civic and utility apps this matters most: people download a city services app because a letter told them to, and it competes with the browser they already used.
Shorten the path to the first outcome. Measure time from open to first meaningful action, then remove steps until it lands inside one session. Social login, saved preferences between sessions, and removing the tutorial all help. Do not add a step in the same release you remove one; that is how teams lose a quarter without noticing.
Fix performance where it is felt. Useful targets: cold start under two seconds, API success rate above 99.5%, freeze rate under 0.4% of sessions, and no full-screen wait longer than three seconds. Cold start time and freeze rate predict uninstalls better than crash count, because a crash is obvious to your team and a freeze is a personal insult to the user’s time that raises nothing.
Ask for permissions contextually. One request, at the moment of use, with a sentence of explanation. Batch prompts at launch convert into denials, and a denied permission frequently becomes a deleted app because the feature is now unreachable.
Make empty states do work. An empty map, empty list, or empty inbox should suggest the first action, preload something plausible, or offer a template. The most common week-one exit is not frustration, it is a blank screen.
Cap notifications. Frequency caps per category, a preference screen reachable in two taps, and no push at all before the user has had a session worth coming back to. Same for interstitials: no ad before the first meaningful action, and none during it.
Place the paywall after a first success. Someone who has just completed the thing they paid for will consider paying for the next one. Someone blocked before the first success just leaves.
Rescue the day-one return. The second session is where habits either start or die. A short, useful message inside the first 24 hours tied to what the user actually did is worth more than a generic welcome sequence, and far more than a rate-the-app prompt, which should not appear before a second successful session.
How App Teams Should Measure First-Week Retention
You cannot fix what you cannot separate, so the measurement setup matters more than the benchmark you compare against. There is no universal number. A weather app and a banking app have completely different reasonable day-one figures, and any article quoting one benchmark for every category is misleading you.
Track this set:
- Day-one retention — share of new users returning the next calendar day.
- Day-seven retention — the first-week headline. Day one tells you the session worked; day seven tells you there is a reason to return.
- Activation rate — the share of installs that reach your defined meaningful action.
- Time to first value — from open to that action. Median and 90th percentile both matter; the slow tail is where the exits are.
- Onboarding completion — and completion per step, so you can see which step costs you.
- Permission conversion — request to grant, by permission type and by prompt location.
- Crash-free sessions, ANR rate, freeze rate, cold start time. Track freezes separately from crashes.
- Uninstall reasons by cohort — where you have them.
Build these as cohort tables by install date, not as a rolling average. A rolling day-seven number moves too slowly to tell you whether last Tuesday’s release helped.
Two honest limits are worth stating. Analytics cannot see an OS-level removal, so on Android you should watch install counts by device model and compare them against sessions from the same models; a gap in one model is a signal about OEM battery policy or MDM. And apps cannot reliably detect their own uninstall on iOS, so do not build a “we know when they left” feature without checking the current platform rules for your category.
For experiments, change one part of the first session, run it against a control, and read day-seven retention. Step completion rates improve constantly without moving retention at all, which is how teams ship onboarding work for a year and wonder why nothing changed.
One category note, since it changes how you read the numbers: travel, streaming, gaming, dating, and seasonal utility apps are partly designed to be uninstalled and reinstalled. A user deleting a travel app in January is normal behavior. Judge those apps on reinstall rate and session quality, not on a flat week-one number.
Frequently Asked Questions
What percentage of users uninstall an app in its first week?
A common industry estimate puts abandonment after a single use near 25%, and more than half of installs are gone within the first month. Those figures come from older published studies and vary widely by category, platform, and acquisition source. Treat them as orientation rather than a target: your own day-one and day-seven cohort figures, split by channel, are the only numbers worth acting on.
Is a long onboarding flow always bad for retention?
Not always, but length is almost never the real problem. A tutorial that walks a user through exactly what they came to do can raise day-seven retention, especially in complex or unfamiliar categories where confidence is low. What hurts is length that arrives before value, asks for information the app does not need yet, or offers no way to skip. Judge onboarding by whether the user reaches a meaningful outcome sooner, not by how many screens it has.
Should an app ask for permissions before showing its core value?
Almost never. Permission prompts asked at first launch get denied at high rates because the user has no reason to grant them yet, and a denied permission frequently becomes a deleted app when the feature becomes unreachable. Ask at the moment the feature is used, with one sentence explaining what the permission unlocks. Notification permission is the usual exception, since it determines whether any follow-up message can reach the user at all.
What is the difference between day-one and day-seven retention?
Day-one retention measures whether the first session worked, so it mostly reflects onboarding, load time, and the time to first value. Day-seven retention measures whether there is a reason to come back, so it adds the value of the second and third sessions and the habit forming around them. An app can post healthy day-one numbers and still lose most users by day seven, which is usually a sign the value was one-off rather than recurring.
How can a small app team find out why users uninstall?
Segment new users by acquisition source and device, then walk the funnel for the worst segment only and find the biggest drop. Watch session recordings for that step rather than relying on surveys, since uninstalling is a low-effort action that rarely produces feedback. Compare the first sessions of users who returned on day seven against those who did not, then test the fix you suspect and read day-seven retention, not just completion rates.
Conclusion
Start with the highest-value journey in your app, the one action that makes everything else worth keeping. Pull the week-one cohort for that journey, segmented by channel and device, and find where the drop is steepest. Then remove the single biggest source of friction on that path and validate it with one focused day-seven retention experiment before you touch anything else.
Why users uninstall apps in the first week is rarely a mystery about user taste. It is a cost the user paid before your app returned anything, and the teams that fix it fastest are the ones willing to look at the first session instead of the quarterly churn chart.