Sensor networks handle battery life in four layers: spend as little energy as possible per reading, keep each node in deep sleep nearly all the time, send small payloads at long intervals over a low-power radio, and top the battery up with harvested energy where the site allows. Everything else is arithmetic on top of those four moves.
That direct answer only works if you know where the energy goes, so this guide walks through the drain first, then the eight techniques that actually move the number, a worked battery-life calculation you can run on your own node, and the field telemetry that tells you when to go fix a node before it goes dark.
Table of Contents
- What Determines Battery Life in a Sensor Network?
- How to Reduce Energy Use at the Sensor Node
- Reduce radio energy
- Reduce sensing and processing energy
- Disconnect what is not being used
- How Sensor Networks Balance Reporting Frequency and Coverage
- How Sleep Modes and Wake-Up Strategies Extend Battery Life
- The conventional sleep architecture
- Ship mode is a supply-chain decision
- When a node can safely sleep
- How Energy Harvesting Helps Remote Sensor Networks
- How Network Protocols Conserve Battery Power
- How to Estimate Battery Life Before Deployment
- A worked example: temperature and humidity every 15 minutes
- What Should Teams Monitor After Deployment?
- Frequently Asked Questions
- How does a battery sensor work?
- How does a wireless sensor network work?
- Why is energy efficiency critical in wireless sensor networks?
- What types of sensors are commonly used in battery management systems?
- What is duty cycling in wireless sensor networks?
- Can solar replace batteries in a sensor network?
- Conclusion
What Determines Battery Life in a Sensor Network?
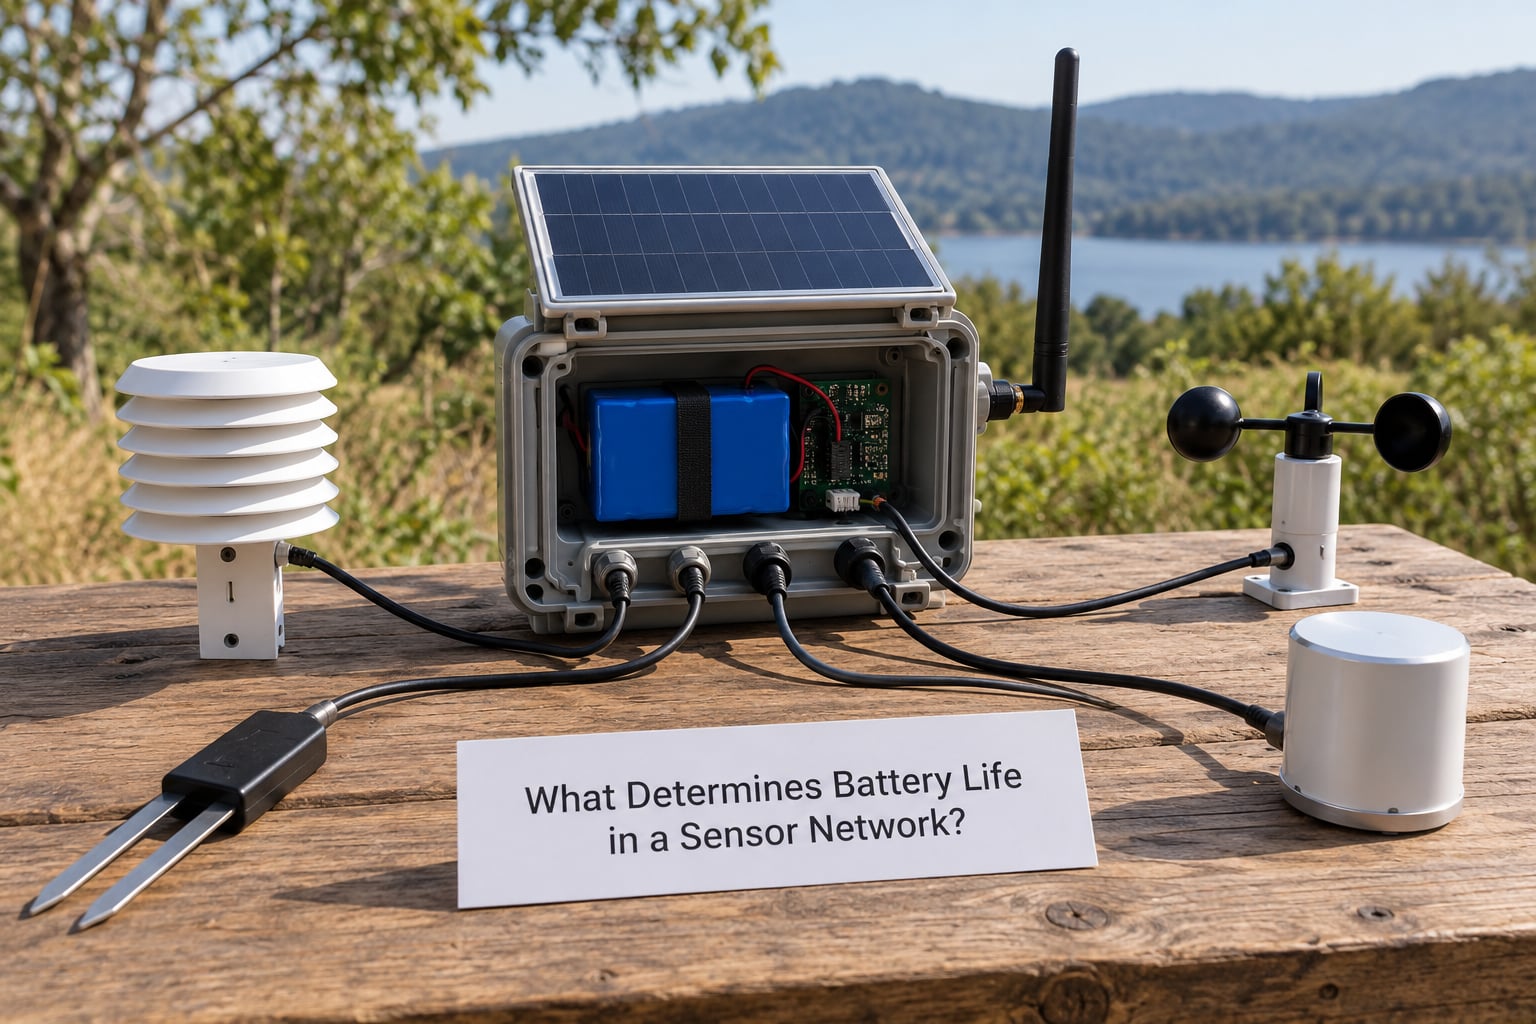
The radio decides more than anything else. A node that idles might draw around 0.1 W of system power, while the same node pushing a transmit burst can sit near 7 W — a jump of roughly 7,000 percent. Everything else in the budget is smaller.
Battery life is the integration of five things: how much capacity the cell holds, how much current the node draws while awake, how much it draws while asleep, how many times per day it wakes, and how fast that capacity fades in the temperature the node actually lives in.
| Factor | Typical effect on service life |
|---|---|
| Transmit airtime and spreading factor | Dominant cost. Higher spreading factor means longer airtime on air, so more transmit energy for the same payload. |
| Reporting frequency | Linear until sleep current dominates. Going from every 5 minutes to every 15 minutes cuts the active portion of the budget by two thirds. |
| Sleep current | Sets the floor. Below about 1 percent duty cycle it becomes the largest single term in the daily budget. |
| Network topology | Mesh nodes wake to relay other nodes’ traffic, so a mesh node spends energy it did not generate itself. |
| Temperature | Cold cuts usable lithium capacity sharply and slows the chemistry, which is why winter is when fleets start dropping out. |
| Battery chemistry and self-discharge | Sets a calendar-life ceiling. A cell can expire on its own long before the node drains it. |
| Sensor load and signal conditioning | Humidity, gas, and inertial sensors can hold a heater or amplifier on continuously, which quietly becomes a permanent load. |
Network activity is the sneaky one. A quiet RF environment lets the node sleep at a low data rate, while a noisy one forces retransmissions, and a node that joins a new gateway every night pays join energy it never planned for.
How to Reduce Energy Use at the Sensor Node
Start by cutting the awake current, then cut the number of awake seconds. Those two levers are independent, and most designs need both.
Reduce radio energy
Send less. A node that reports a single packed integer instead of a JSON payload cuts airtime, and airtime is the one thing that scales linearly with transmit power. Turning off acknowledgements where the application can tolerate a lost sample removes an entire receive window per report.
Lower the transmit power to the minimum the link budget allows. The radio datasheet’s receive and idle figures matter as much as the transmit one, so choose a transceiver whose receive current is measured in microamps rather than milliamps.
Reduce sensing and processing energy
Sample sensors on a schedule, not continuously, and read each one at the first conversion result rather than polling in a loop. Move filtering and thresholding to the node so the gateway receives one decision instead of a thousand raw samples — that is report by exception, and it is the single biggest data-volume win in remote deployments.
Run security on hardware. Software AES on a small microcontroller keeps the core busy for milliseconds at high current; a crypto accelerator does the same work almost for free. And if your node pulls 12 V from a cell, budget the boost converter too — switching regulators sit anywhere from about 1 uA to 7 uA of quiescent current depending on the part, which is a large slice of a sleepy node’s entire daily budget.
Disconnect what is not being used
Sensors, the radio, and status LEDs all keep drawing unless something physically isolates them. A load switch between the battery rail and the sensing domain is the standard answer, and it costs almost nothing in board area.
How Sensor Networks Balance Reporting Frequency and Coverage
Reporting frequency is the design decision teams argue about longest, because every doubling of the interval buys back energy while costing temporal resolution. The four common patterns differ more in what they cost than in how they are built.
| Reporting strategy | How it behaves | Battery trade-off |
|---|---|---|
| Always-on | Radio stays listening, gateway pushes downlinks whenever it likes | Worst case. Useful for a mains-powered node, rarely valid on a cell. |
| Periodic | Fixed interval wake, read, transmit, sleep | Predictable and easy to plan around. The default for environmental monitoring. |
| Event-driven | Node sleeps until a threshold, motion, or external interrupt fires | Best possible battery life on quiet sites, and no visibility at all during the quiet stretches. |
| Adaptive | Interval widens when nothing is changing and tightens when it is | Good middle ground; needs care so the widening never crosses a threshold you care about. |
A GPS asset tracker makes the difference concrete. One vendor’s figures put the same device at about a week of service reporting every five minutes, about three weeks reporting hourly, and roughly six months reporting daily. Nothing about the hardware changed — only the schedule.
Coverage works the same way. A high-gain but infrequent report reaches further with the same energy budget than a frequent low-power one, because link budget buys airtime, not frequency.
How Sleep Modes and Wake-Up Strategies Extend Battery Life
Deep sleep is where most of the calendar comes from. A sensor node that reports every 15 minutes is awake for well under 1 percent of the day, so the sleep current sets the floor for the entire battery life calculation. Optimising it is the highest-leverage change you can make.
Quiescent current, sleep current, and shutdown current are three different numbers. Quiescent is what the radio draws with everything nominally off, sleep is the MCU in its deepest state with the RAM retained, and shutdown disconnects the battery entirely. Measured examples from published teardowns sit around 170 nA for a conventional deep-sleep design versus about 10 nA once a dedicated nanopower controller replaces the discrete real-time clock and load switch, with shutdown figures landing in a similar band at roughly 26 nA and 30 nA.
The conventional sleep architecture
The classic build uses a real-time clock to wake the microcontroller, a load switch to isolate the battery, and a push-button or fresh-battery controller to prevent drain in the supply chain. It works, and it is where the dozens of microamps of always-on support circuitry come from.
An integrated nanopower controller folds the RTC, load switch, and fresh-battery logic into one part. Published comparisons report around 20 percent longer battery life alongside roughly 60 percent smaller board area, which is why the discrete pattern has largely disappeared from new designs.
Ship mode is a supply-chain decision
Ship mode electrically disconnects the battery so cells do not drain while a unit sits in a warehouse or on a shelf. For a city ordering 2,000 nodes and commissioning them in phases, the difference between a cell that has been sitting for eight months and a fresh one is real money and real field debugging.
When a node can safely sleep
Sleep safely when the thing you are watching changes slowly compared with your interval, and when a missed sample costs nothing. Water level, temperature, and soil moisture tolerate gaps. A flood gate alarm does not. Shorter intervals cost roughly in proportion, so decide the shortest interval your alerting requirement can survive, then use that number as the design target instead of the shortest one you can technically achieve.
How Energy Harvesting Helps Remote Sensor Networks
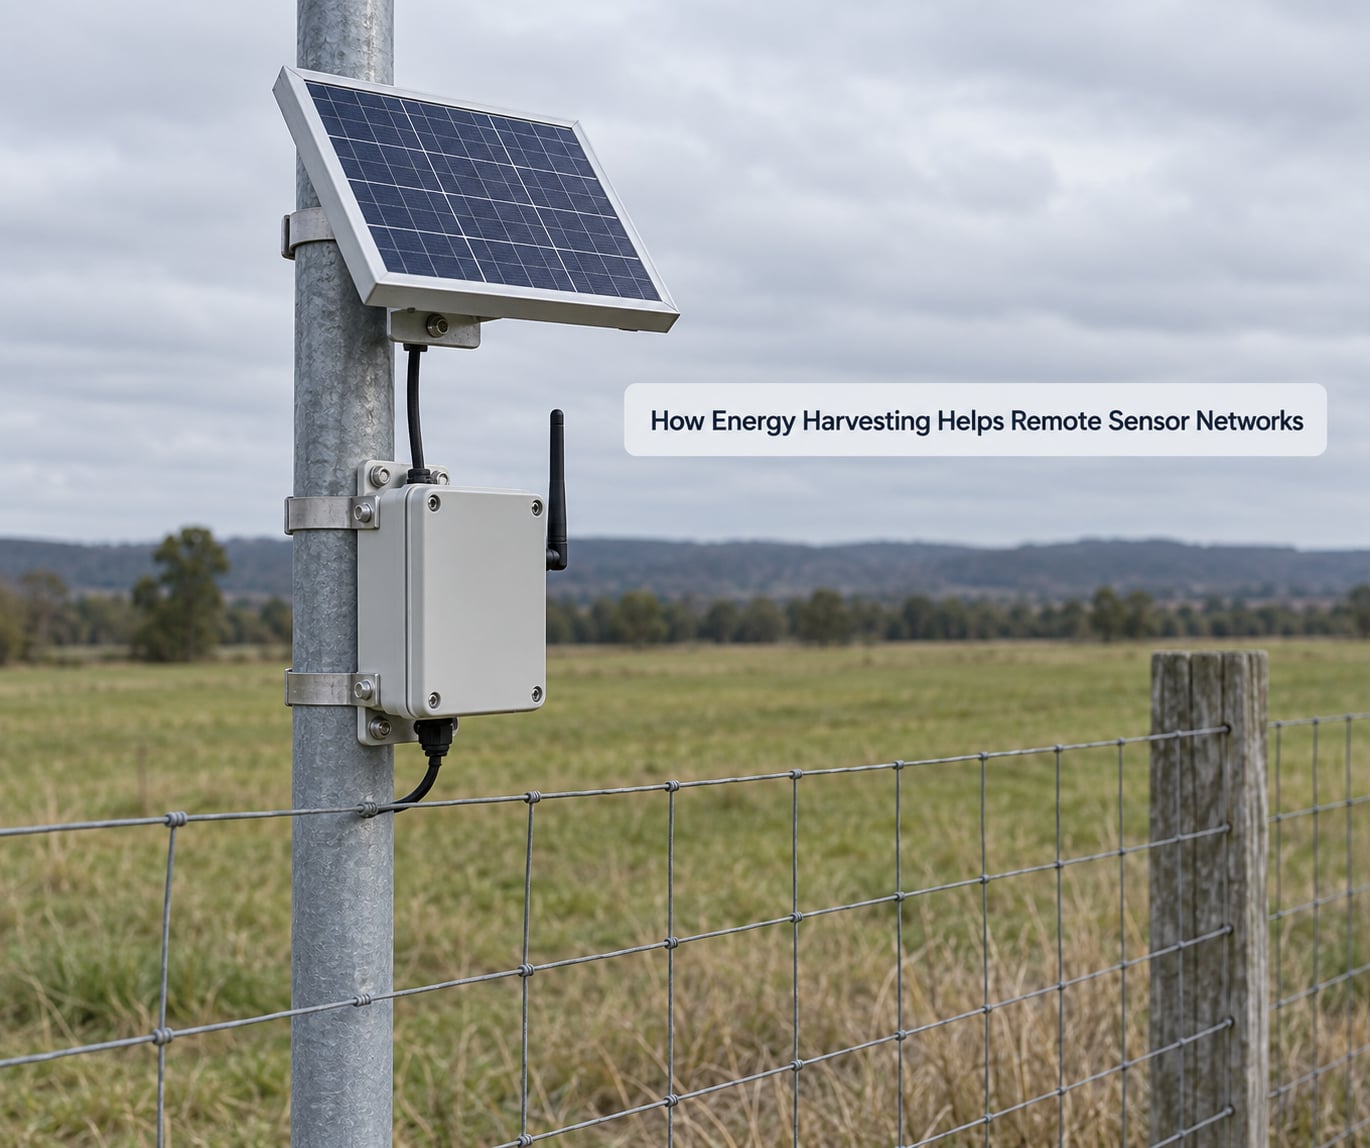
Harvesting changes the maintenance model, not the battery requirement. A node that nets a positive average energy budget still needs a cell that carries it through the worst stretch, usually a multi-week run of dark winter days, because energy storage has no choice about the weather.
| Harvesting source | Suitable deployments | Practical limitation |
|---|---|---|
| Solar panel | Fixed outdoor nodes with sky exposure: weather stations, smart irrigation, parking sensors | Output collapses for weeks in winter or under canopy; sizing needs a worst-month budget, not an average one. |
| Thermal gradient | Pipes, HVAC plenums, and hot equipment housings where a constant differential exists | Output falls to almost nothing when the pipe is at ambient, which is exactly when the leak is not happening. |
| Vibration and kinetic | Vibration-heavy industrial sites, machinery, and some pipeline nodes | Depends on machinery running. A quiet weekend produces no energy at all. |
| RF and inductive | Metering devices read wirelessly by an in-line or nearby energy source | Weak and variable at distance; needs the field to stay reliably powered. |
Storage choice follows the source. A supercapacitor buffer handles a harvest burst and a cell handles the long dark stretches, and pairing the two is more reliable than either alone. Over-the-air charging is a fourth option for asset trackers, where a host device with a larger battery tops up the tag in a pocket or a crate.
How Network Protocols Conserve Battery Power
Protocol choice decides how much listening a node must do, and listening is the most expensive state in every radio stack.
LoRaWAN Class A is the battery-friendly one: the node transmits, opens two short receive windows, and goes back to sleep. Class B adds scheduled listening beacons for downlink latency and costs real energy. Class C keeps the receiver open continuously and belongs on mains power, not a coin cell.
Inside LoRa, the spreading factor and adaptive data rate trade range for airtime. A node close to a gateway runs a high data rate with short airtime, and a node at the edge slows down to reach further, which means every transmission takes longer. Adaptive data rate handles this automatically, and it is the difference between a fleet that lasts three years and one that lasts nine.
Bluetooth Low Energy pays for range in connection intervals: a longer interval means fewer wake-ups and better battery life, within the advertising budget the protocol allows. Cellular nodes use power saving mode and extended idle periods instead, where the device is reachable but only checks in occasionally. Zigbee and other mesh protocols keep receivers on much of the time, which is why mesh nodes age faster than leaf nodes in the same network.
Topology changes the load. A point-to-point link keeps every byte on the node that produced it. A star does the same but adds gateway contention. A mesh forwards other nodes’ traffic, so relay nodes pay for the network’s total load, and that is the honest cost of coverage and self-healing.
How to Estimate Battery Life Before Deployment
Estimate the daily energy budget first, then divide a realistic usable capacity by it. The formula in plain text: average current in microamps equals sleep current plus wake current multiplied by the awake fraction, plus transmit current multiplied by the transmit fraction. Daily consumption in milliamp-hours equals average current in microamps multiplied by 24, then divided by 1,000.
A worked example: temperature and humidity every 15 minutes
Take a node with 3 uA sleep current, an average awake draw of about 5 mA for the sensor read and packet build, and a LoRa transmit at SF9 averaging 20 mA for 0.19 seconds per packet. Assume retries and re-joins add about 60 percent on top, which is realistic in a real RF environment.
Per 15-minute cycle the sleep term is 3 uA over 900 seconds, the sensor and processing term is roughly 5 mA over 0.06 seconds, and the radio term including retries lands near 8 mA-seconds of charge. Total daily: sleep contributes 72 microamp-hours, and 96 reporting cycles contribute about 213 microamp-hours, giving roughly 285 microamp-hours per day, or 0.285 mAh.
Now derate honestly. A 2,400 mAh lithium thionyl chloride AA cell at 60 percent usable capacity after cold, ageing, and pulse effects gives 1,440 mAh. Divide by a safety factor of 3 to cover the unknowns you will discover in the field and you have 480 mAh of usable budget. At 0.285 mAh per day that is about 1,680 days, or 4.6 years.
Switch the same node to hourly reporting and the active term falls to roughly 53 microamp-hours while sleep stays at 72. The daily budget drops to about 0.125 mAh and the estimate moves past 10 years — which is where the cell’s own self-discharge, around 1 percent a year for this chemistry, becomes the limiting factor rather than the load.
Verify on the bench before you trust any of it. A current-profiling power analyser on the real radio module will show you the retry overhead that the datasheet never mentions, and the number you measure will always be worse than the number you calculated. Budget for that.
What Should Teams Monitor After Deployment?
The deployment is when the model meets reality, and telemetry is how you find out which assumption was wrong. Four signals cover most failures.
Battery voltage under load. Report the terminal voltage with each packet, not a smoothed average. A node whose resting voltage looks fine but sags below the transmit threshold is a node about to drop out.
Missed heartbeats. Count expected reports against received reports per node per day. A gap that opens gradually points at the battery, while a sudden gap points at the radio or the gateway.
Retry and join counts. Track join requests per day and the ratio of acknowledgements to transmissions. A node that re-joins every night is burning several times the energy you budgeted, and it will not show up in a voltage alarm until much later.
Reporting success against temperature. Log ambient temperature alongside battery voltage. If failures cluster in the cold months, the fix is capacity, not firmware.
Once these feed a dashboard, battery life stops being a design promise and becomes a scheduled maintenance task. Nodes below a voltage threshold go onto a replacement list ordered by severity, so a truck roll fixes the nodes that are actually dying instead of every node that happens to share a site.
For a city fleet, the useful planning number is not the best-case node life but the distribution. If the median node lasts five years and the tenth percentile lasts two, then one site in ten needs attention on a two-year cycle, and that is the figure your maintenance budget and your public works schedule should be built on.
Frequently Asked Questions
How does a battery sensor work?
A battery sensor runs a small circuit on stored chemical energy. The microcontroller wakes on a timer, powers the sensing elements, reads them, converts the readings to a number, transmits it, and returns to a low-power state. Between readings the node draws microamps or less, which is why the battery lasts months or years rather than hours.
How does a wireless sensor network work?
Nodes take readings, send them over a radio to a gateway, and the gateway forwards the data to a server. They can talk directly to one gateway, through a gateway in a star, or relay each other’s packets in a mesh. Each node usually runs on its own battery, so every node has to manage its own power budget independently.
Why is energy efficiency critical in wireless sensor networks?
Nodes are usually placed where mains power does not reach and where access is expensive or dangerous. Every battery change means a truck roll, a traffic lane closure, or a site visit. When per-node energy use falls, the interval between maintenance visits stretches, and the difference between a one-time deployment cost and a recurring annual cost is the whole project economics.
What types of sensors are commonly used in battery management systems?
Battery management systems measure voltage, current, and temperature to track state of charge and detect failing cells. On a sensor node, the same idea applies: thermistors, voltage dividers, and fuel gauges or coulomb counters on the cell report remaining capacity back to the firmware. The readings tell the network when a node needs attention instead of waiting for it to go dark.
What is duty cycling in wireless sensor networks?
Duty cycling means a node spends only a small fraction of each cycle active and returns to deep sleep for the rest. For sensing applications the active share is often between 0.01 percent and 1 percent. Because the sleep current then dominates the energy budget, most teams optimise sleep current first and transmission airtime second.
Can solar replace batteries in a sensor network?
Not reliably. Solar output collapses for weeks in winter and under canopy, so a node still needs a cell or supercapacitor to ride through the darkest stretch. Harvesting cuts how often you visit a site, which is the real win, but sizing has to follow the worst month of the year rather than the annual average.
Conclusion
Measure your node’s sleep current and real transmit airtime on the bench first, because those two numbers decide everything downstream. Then set the reporting interval to the longest your application can survive, run the daily budget calculation, and derate for cold, ageing, and retries before you commit to a replacement schedule.