The digital divide affects city services whenever a department moves a task online that residents still need to complete. Residents without reliable broadband, an affordable device, or the skills to navigate a portal cannot apply for a permit, pay a utility bill, sign up for alerts, or register to vote. The service exists on paper, but not in practice for them.
That is the whole mechanism. Everything else is detail: which services break, who breaks with them, how a city measures the damage, and what it does about it.
Last updated: October 2026
Table of Contents
- What Is the Digital Divide?
- What Causes the Digital Divide in Cities?
- How Digital Divide Affects City Services
- What Service Gaps Look Like Across Different Communities
- How Cities Can Measure the Problem
- How Cities Can Reduce Digital Exclusion
- What Makes Digital City Services Truly Inclusive?
- Frequently Asked Questions
- What is the difference between digital inequality and the digital divide?
- How can older adults be excluded from online city services?
- Does broadband availability mean residents have meaningful digital access?
- What should cities do during an emergency when the digital divide is high?
- Are online-only city services lawful?
- How can a city measure whether digital inclusion is improving?
- Conclusion
What Is the Digital Divide?
The digital divide is the gap between people who can reliably get online, afford the service and a device, and use them with confidence, and people who cannot. It becomes a city service problem the moment a permit, payment, alert, or application exists only in a browser.
Most municipal work uses the three A’s: accessibility, affordability, and adoption. Accessibility is whether high-speed internet physically reaches a home. Affordability is whether a family can pay for the plan and the device. Adoption is whether people who have access actually use it well enough to finish a transaction.
Missing any one of the three is enough to block a resident. A street with fiber in the ground is not digital inclusion if the monthly bill is unaffordable or the form is unreadable on a phone.
Underneath the three A’s sit three levels of exclusion, and each one breaks a different service:
- First level, access and connection quality. No coverage at all, or coverage that cannot hold a session together. A permit upload that stalls at 80 percent on a 4G phone is a lost permit as far as the resident is concerned.
- Second level, skills and devices. The connection exists and the person still cannot complete the task: no computer in the home, an old phone, a shared family device, or a form that requires literacy they never acquired.
- Third level, outcomes. Trust, language, accessibility, identity requirements, and payment options. A resident who speaks Spanish, distrusts the city after three bad experiences, has no email account, or uses a screen reader hits a wall even with fast free Wi-Fi and a support person sitting next to them.
Brookings summarized the scale using American Community Survey data from 2018: 27.9 million urban households, about 10.8 percent of the urban population, lacked a broadband subscription. Pew Research has put the share of US adults who are relatively hesitant with new technology at roughly 52 percent. Different measures, same message: connectivity and capability are two separate problems, and most cities have both.
What Causes the Digital Divide in Cities?
Causes overlap, and in most cities you will find four or five operating at once. Here are the ones that show up in service data.
Income and housing cost. Broadband competes with rent, food, and transport in a household budget. Income also determines what kind of device is in the home. One subsidized plan is not the same as a working laptop for a child doing homework.
Device cost. Plenty of households have coverage and no computer. Or a phone with a cracked screen and a data cap. Every portal that assumes a laptop, a printer, and a scanner quietly prices out a group of residents.
Age. Older residents are far more likely to lack a broadband subscription, though many of them use smartphones heavily. Services built only around desktop web portals lose them first.
Disability. Uncorrected PDFs, images of text instead of text, timed sessions, CAPTCHA, and drag-and-drop uploads block residents who use screen readers, keyboard navigation, or speech input.
Language. A form translated only by machine, or a phone line that offers no interpretation, is a closed door for the residents most likely to need city help.
Geography and housing instability. Urban cores, not just rural edges, have coverage gaps and building-level problems: thick concrete, old wiring, no rooftop line of sight, or crowded neighbors saturating the same wireless tower. Residents in shelters, transitional housing, or vehicles have no fixed address a provider will install to.
Coverage quality, not just coverage maps. FCC data can show a provider in a census block while the real experience is unusable. Wisconsin’s Public Service Commission put the share of residents without access to at least one fixed broadband service at effective speed at 6.8 percent. Speed is the operative word.
Digital literacy. Public Wi-Fi does not fix this. Someone who has never reset a password or opened a PDF attachment still cannot submit an application, no matter how good the coverage map looks.
Institutional trust. Residents who have been processed slowly, given wrong answers, or lost data online are cautious. Requiring an account, a working email address, and a phone number before a person can even ask for help is a trust tax on every transaction.
Service design that excludes by default. This one is entirely in the city’s hands, which is also why it is the fastest one to fix.
How Digital Divide Affects City Services
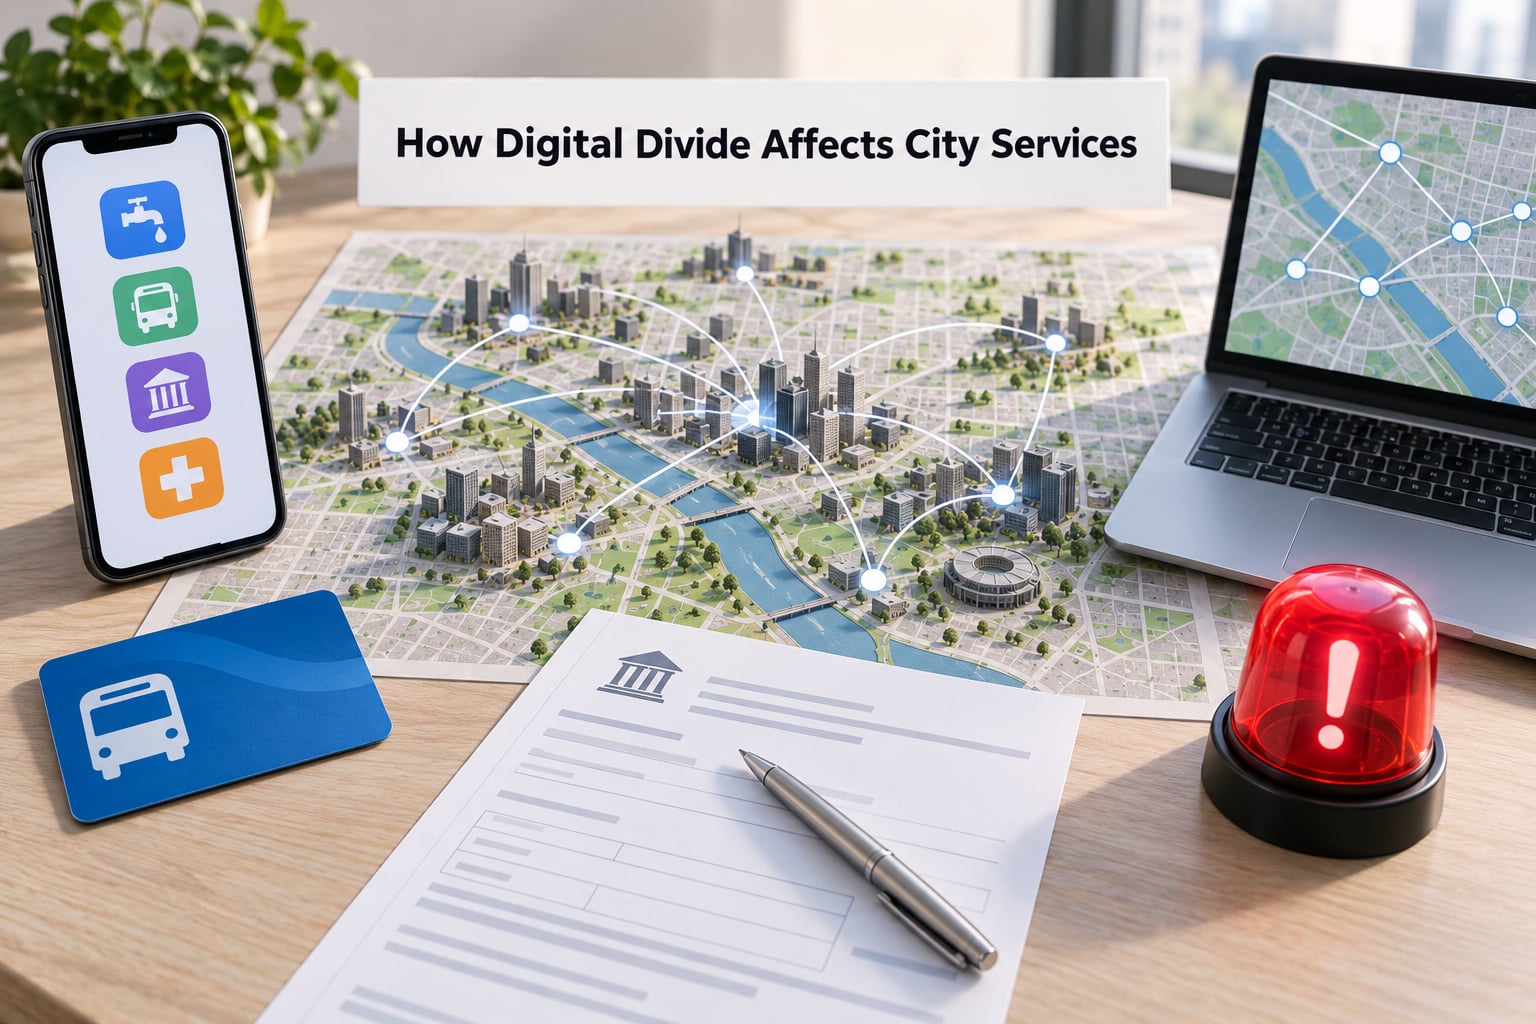
The damage is not evenly spread across departments. Services fail in different ways, and the offline fallback matters as much as the online channel.
| City service | How the divide bites | Required non-digital fallback |
|---|---|---|
| 311 service requests | Online-only intake or an app-only channel pushes reports to phone and staff, lengthening response times for everyone | Phone intake, staffed counters, neighborhood outreach with mobile reporting kits |
| Permits and building applications | Uploads fail on slow connections, document size limits exclude phone-only residents, and print-and-scan workflows assume equipment | Counter submission, mail and drop-box intake, staff-assisted submission over the phone |
| Utility billing and payments | Autopay requires a bank account and reliable email; a missed payment is more damaging with less notice | Pay-by-phone with fee parity, walk-in payment, mailed checks, shutoff protection staff can explain |
| Benefits and assistance enrollment | The hardest applications, the highest stakes, and the strictest identity and document rules fall to the residents least able to complete them online | Assistive in-person enrollment, application assistance line, partner site referrals |
| Business licensing and renewals | Small businesses without IT support lose renewal windows and pay late penalties the city set | Assisted renewal service, printable renewal by mail, a person who can file it for them |
| Parking permits, tickets, and appeals | Appeals carry deadlines that only online notices make visible, so unconnected residents lose by default | Mailed and in-person appeals, ticket notices by post, phone dispute line |
| Trash, recycling, and bulk collection | Pickup changes pushed by app and email are missed by residents who are not on those channels | Mail and printed calendars, door-hanger notices, service alerts through non-digital channels |
| Emergency alerts and public safety notices | Only residents who opted into an app receive warnings about flooding, fire, or shelter closures | Wireless emergency alerts to any compatible handset, sirens and signage, radio and multilingual broadcast |
Three patterns repeat across that table. First, abandonment: a resident starts a transaction, hits a wall, and leaves without telling anyone. The city’s dashboard shows a completed visit, not an incomplete task. Second, the repeat trip: the failed online attempt does not cancel the in-person trip, so the counter queue absorbs work the portal was supposed to absorb. Third, alerts that only reach people already online, which matter most exactly when they matter most.
Research from the urban e-government literature has pointed the same way for a long time. Counties with lower median income and higher poverty rates were less likely to offer any of twelve common e-services in the first place, so the least served places often had the fewest digital options to start with.
The divide also hits connected residents, which surprises people who think of this as a charity problem. When only the easy half of the population can transact digitally, the city cannot retire its counters, so it runs two systems at twice the cost. Staff absorb dual training. Data stays split between systems that do not talk to each other, and the modernization case for the whole program quietly weakens. Common Sense Media made this argument in 2022 and it has held up.
What Service Gaps Look Like Across Different Communities
The same city service behaves very differently depending on who is using it. This is the comparison that matters when a department argues about whether a service is working.
| Community or population | Connectivity | Device access | Skills | Language support | Typical service-design gap |
|---|---|---|---|---|---|
| Affluent, owner-occupied neighborhood | Fiber or fast cable, reliable | Personal laptop and phone | High | English | None that shows up in complaints |
| Older residents in subsidized housing | Coverage present, quality uneven | Shared phone, no computer | Low to moderate | Often needs multilingual support | Desktop-only portals, password resets by email |
| Renters in older multifamily buildings | Weak in-building signal, contested installer access | Phone only, often data-capped | Varies widely | Varies | Assumption that the household chooses its own provider |
| Residents with disabilities | Usually adequate | Varies, assistive tech in use | Varies | Sign language or other needs | Inaccessible documents, CAPTCHAs, timed sessions |
| Residents with limited English | Often mobile-only | Phone, sometimes a shared tablet at a library | Task-specific | Translation and interpretation needed | Machine-only translation, English-only notices |
| Residents without stable housing | Intermittent, often cellular | One device, no charger at times | Low for forms and accounts | Varies | Address and identity requirements that exclude them |
Here is how the same service splits. A resident in a well-connected neighborhood applies for a building permit on a laptop in nine minutes, sees the status tracker, and gets inspection notices by email. A renter three blocks away on a phone-only plan tries the same application, cannot upload the survey file because of the size limit, loses the session, and starts over the next night. When they finally show up at the counter, staff cannot see the half-finished submission, so they pay the fee again and queue behind everyone who finished online.
Neither resident did anything wrong. The service simply made different assumptions about them.
How Cities Can Measure the Problem
You cannot fix a divide you have not mapped, and citywide averages hide the neighborhoods that matter. A practical framework pairs infrastructure data with the city’s own service transactions.
| Indicator | What it shows | Typical source |
|---|---|---|
| Broadband availability | Whether a provider and adequate technology reach each address | FCC Broadband Deployment Data, provider and ISP filings, state maps |
| Connection quality | Whether the service holds up for uploads and video, not just speed tests | Resident speed test surveys, help desk reports, call center symptom logs |
| Device access | Whether households have a computer and a working phone | Short resident survey, American Community Survey, library and school referral data |
| Digital skills level | Whether residents can complete a real task, such as uploading a document | Task-based resident survey run with libraries and community groups |
| Failed and abandoned transactions | Where the online process actually breaks, step by step | Portal analytics, error logs, session drop-off reports |
| Completion rates by neighborhood | Whether services finish at the same rate everywhere | Department case systems joined to address and neighborhood, with privacy controls |
| Wait times by channel | Whether counter and phone demand is rising as online volume rises | 311 and counter operations data, call center reporting |
| Language and accessibility needs | Which languages and formats are required for real completion | Assisted-channel records, translated page demand, accommodation requests |
| Satisfaction gap | Who feels excluded, which raw completion rates miss | Post-service survey by channel and neighborhood, community listening sessions |
Wisconsin built a repeatable version of this: a resident survey instrument that jurisdictions can run locally while keeping results comparable across the state, combining self-reported service type, a speed test, and neighborhood context. That is a good model because it measures quality, not just coverage.
Three rules keep the work defensible. Participation stays voluntary and clearly explained, because a survey about connectivity that looks like an eligibility check will attract only the people who already have service. Data stays aggregated to neighborhood or larger, never tied to an individual record without consent. And analysis breaks results out by neighborhood, age band, language, disability status, and device type rather than reporting a citywide percentage that hides everything interesting.
Publish the results. A digital equity plan with no published numbers is a press release.
How Cities Can Reduce Digital Exclusion
Prioritize in this order. Connectivity and device programs fix the biggest barrier but do nothing for someone who can get online and still cannot finish the form, so service design has to move in parallel, not afterwards.
- Broadband availability and affordability. Map the gaps with the state broadband office and program administrators, use federal broadband deployment funding for construction in low-coverage blocks, and promote the Lifeline program and any available connectivity subsidy in multiple languages through trusted local organizations. The common mistake is funding construction in areas that were already served and calling it equity work.
- Public Wi-Fi and shared devices. Extend service through libraries, community centers, and housing sites, with real capacity, staffed hours, and private space for anyone completing a benefits or immigration form. The common mistake is installing access points and leaving residents to figure out the login, the captcha, and the printer alone.
- Digital skills programs. Teach the task, not the device: how to upload a document, reset a password, read a notice, and use a city’s portal. Run it through libraries, schools, and senior programs, in the languages residents actually speak. The common mistake is buying tablets for classrooms and never touching the city’s own forms.
- Accessible, mobile-first services. Build to accessibility standards, test with screen readers and keyboard only, compress uploads, and design for a slow phone on a weak connection. The common mistake is launching a new portal before the old PDF form and counter process are retired on the same day.
- Multilingual and plain-language service. Translate notices and forms by humans, provide interpretation on phone lines, and write to a reading level a stressed resident can follow at 11 pm. The common mistake is shipping machine translation and treating it as finished work.
- Maintain phone, mail, and in-person channels with equal service quality. Keep the fee parity, the same turnaround times, and the same staff knowledge. The common mistake is keeping a phone line open as a courtesy while cutting its staffing, which just converts the divide into a wait.
- Staff training. Front-desk and 311 staff should be able to complete the online task for a resident on request and know the offline fallback. The common mistake is training staff on the new portal only, so they cannot help anyone who cannot use it.
Some cities have built standing capacity for this rather than treating it as a project. Brookings has documented how digital equity offices, reporting to the mayor with a published plan and a seven-figure annual budget, keep a city in contact with what its residents actually need. Named examples in that research include Seattle’s funded community organizations, Boston’s fiber build, San Francisco’s strategic plan, New Orleans’s Lifeline outreach, Louisville’s programs, and Portland’s digital inclusion network.
Budgets that size are not the point. Continuity is. Programs that start when a grant starts and stop when the grant stops are hard to plan around, for residents and staff alike.
What Makes Digital City Services Truly Inclusive?
Moving a service online is a channel decision. Digital inclusion is a design standard, and the difference shows up in whether a resident can finish the task, not whether they can load the page.
- Accessibility standards, tested by task. Meet the Department of Justice’s Title II web accessibility rule, and test the flow end to end with a screen reader, a keyboard, and speech input. Automated checkers catch a fraction of what a real task test finds.
- Mobile-first design. Most residents arrive on a phone, often a shared or older one. Design the smallest screen first and stop treating the app as the app and the website as the fallback.
- Low-bandwidth performance. Keep pages light, uploads resumable, and file limits realistic for a cellular plan. Assume the connection drops and let people save their work and return.
- Plain language and translation. Short sentences, named contacts, no legal boilerplate above the action, and human review on every translation.
- Usability testing with the residents affected. Recruit people with low bandwidth, older devices, and assistive technology. Not staff, not volunteers who are already comfortable online.
- Choice of identity and payment. Allow phone-based sign-in, permit payment at a counter or by check, and document upload by email or in person when upload is the blocker.
- Trained staff and equivalent offline channels. Every digital service needs a documented fallback with named owners and service-level targets, reviewed on the same schedule as the portal.
A short checklist for evaluating any city service before it launches:
- Can a resident complete the full task on a phone, over cellular, without an account created in advance?
- Does every step work with a screen reader and a keyboard alone?
- Is the task completable in the top two languages residents use, with a human on the phone?
- Is there a documented offline path, and is it funded in the same budget?
- Do staff know how to complete the task for a resident who cannot?
- Can the department report completion rate and wait time by neighborhood and by channel?
If a service fails the first three questions, the online channel is an improvement for the residents already online and a new barrier for everyone else.
Frequently Asked Questions
What is the difference between digital inequality and the digital divide?
Digital inequality is the broad, persistent pattern of unequal access, use, and outcomes across a population. The digital divide is narrower: the specific gap in access to connectivity, devices, and skills that blocks a person from a particular task or service. Think of inequality as the trend line and the divide as the crack in one service a resident is trying to finish today.
How can older adults be excluded from online city services?
Older residents are more likely than average to live without a home broadband subscription and to rely on a phone. Services designed around desktop portals, emailed password resets, account creation, and long PDF forms push them out even when they use smartphones daily. The fix is a mobile-first design, phone and counter alternatives, and staff trained to complete the task with them.
Does broadband availability mean residents have meaningful digital access?
No. Availability tells you a provider and technology reach an address, not that the service holds together for a permit upload, a video call with a caseworker, or a benefits application. Connection quality, the price of the plan, whether a working device exists in the home, and whether the person can use the interface all sit between coverage on a map and a completed transaction.
What should cities do during an emergency when the digital divide is high?
Never push emergency information into app-only channels. Use wireless emergency alerts that reach any compatible handset without an app, pair them with sirens, signage, radio, and multilingual broadcast, and register residents who opt in for phone and text by non-digital means. Test the coverage map against the neighborhoods with the weakest connections before the event, not during it.
Are online-only city services lawful?
Largely no. A city that receives federal or state funds, or that runs services through public entities subject to state accessibility law, has to meet web accessibility rules under the ADA Title II rule. Those obligations apply to the online channel, and shutting off the counter or phone line instead is both a legal risk and a service failure for residents who cannot go online.
How can a city measure whether digital inclusion is improving?
Track completion rate, abandonment rate, and wait time by neighborhood and by channel, then compare them over time. Pair those with resident surveys covering device access, skills, and language needs, and with a satisfaction survey by channel. If counter visits fall while neighborhood completion rates stay flat, the online channel is shifting work rather than removing it.
Conclusion
The digital divide affects city services the moment a task becomes online-only. Access, affordability, and adoption each fail different residents in different ways, and the damage shows up as abandoned applications, longer counter queues, missed deadlines, and alerts that never reach the people who need them.
Start with one concrete piece of work: map the digital barriers for each essential service, identify which residents are at the highest risk of being excluded, and hold the phone, mail, and counter channels in place, funded and staffed, while the digital ones expand. Everything else, including the smart city program, is easier to defend once that line is drawn.