App maintenance costs add up after launch at roughly 15 to 25 percent of your initial build cost per year, and closer to 25 to 40 percent for complex or regulated apps. Most teams are surprised by the second half of that bill: the non-labor line items, from cloud hosting to third-party API calls, that nobody quotes during the build phase.
Plenty of readers land here with one question in mind, which is how app maintenance costs add up after launch in the first place. The answer is that maintenance is not one expense. It is a standing set of small recurring costs plus periodic spikes, and each one gets a little more expensive as the app ages.
The ranges below are typical US figures. They vary by region, by how many people are logged in, and by the month, so treat them as planning numbers rather than quotes.
Table of Contents
- How App Maintenance Costs Add Up After Launch: Cost by App Type
- What App Maintenance Costs Typically Include After Launch
- What Affects App Maintenance Prices
- How Much Does App Maintenance Cost for a Small App?
- How Much Does App Maintenance Cost for a Public or Civic App?
- How Much Does App Maintenance Cost for a Smart-City Platform?
- Why Maintenance Costs Increase Over Time
- Ways to Save on Post-Launch App Maintenance
- Frequently Asked Questions
- How expensive is it to maintain an app?
- Is it true that 80% of the lifetime cost of a piece of software goes to maintenance?
- Does Google take 30% of in-app purchases?
- How much does it cost to host an Android app?
- What are the hidden costs of maintaining an app after launch?
- Why do app maintenance costs increase over time?
- Conclusion
How App Maintenance Costs Add Up After Launch: Cost by App Type
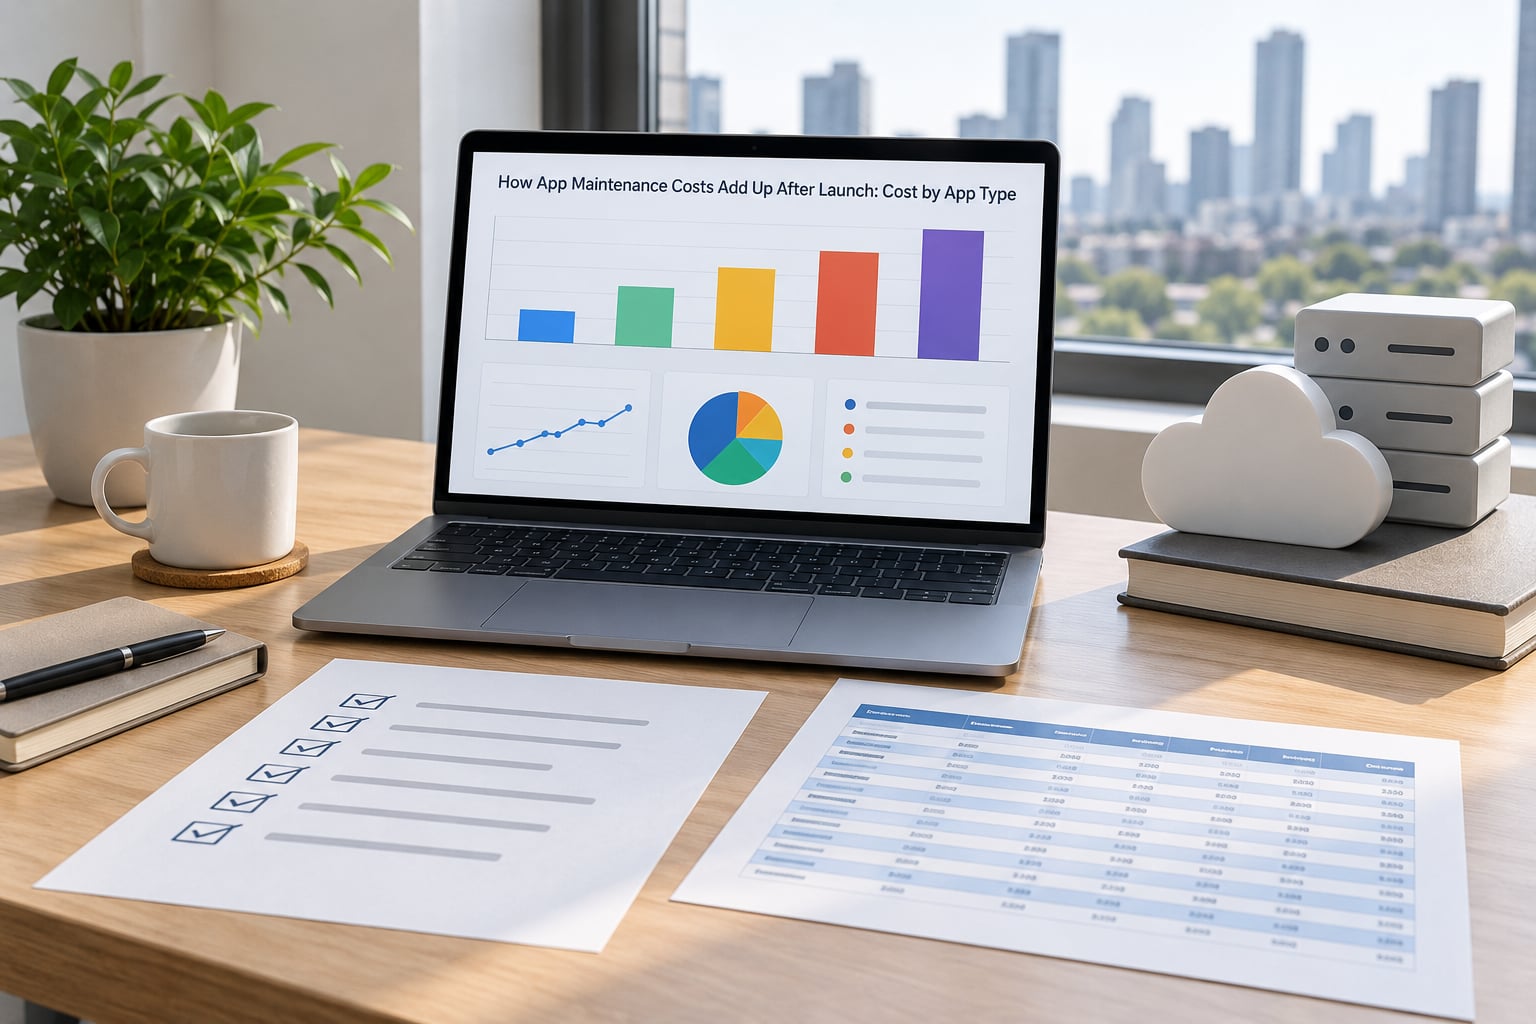
The cheapest way to see the whole picture is to line up three app types side by side. A small internal tool, a public-facing civic or consumer app, and a smart-city platform have almost nothing in common on the maintenance bill.
| Monthly cost line | Small internal app | Consumer or civic app | Smart-city platform |
|---|---|---|---|
| Hosting, databases and data pipelines | 150 to 600 USD | 800 to 4,500 USD | 6,000 to 35,000 USD |
| Monitoring, logging and backups | 50 to 250 USD | 400 to 2,000 USD | 3,000 to 12,000 USD |
| Third-party APIs, SMS, push and maps | 50 to 400 USD | 300 to 2,500 USD | 2,000 to 10,000 USD |
| App store accounts and fees | 12 to 25 USD | 12 to 25 USD | 25 to 100 USD |
| Bug fixes and user support | 500 to 1,500 USD | 3,000 to 9,000 USD | 10,000 to 30,000 USD |
| OS and dependency updates | 500 to 1,400 USD | 2,000 to 6,500 USD | 6,000 to 18,000 USD |
| Security patching | 200 to 800 USD | 800 to 2,500 USD | 3,000 to 12,000 USD |
| New integrations and data feeds | 0 to 500 USD | 1,000 to 4,000 USD | 4,000 to 15,000 USD |
| Compliance and accessibility work | 100 to 600 USD | 800 to 3,000 USD | 2,500 to 9,000 USD |
| Reserve fund | 300 to 1,000 USD | 1,500 to 5,000 USD | 4,000 to 15,000 USD |
| Monthly total | 1,900 to 7,000 USD | 10,600 to 39,000 USD | 40,000 to 158,000 USD |
| Typical annual cost as a share of build cost | 15 to 25 percent | 20 to 30 percent | 25 to 40 percent |
Two figures on that table drive everything else. The small internal app looks almost trivial at a few hundred dollars a month, and it still needs a named owner for its security patches. The smart-city platform line is dominated by things nobody budgets for: observability tooling, identity systems, and the pipelines that keep municipal data feeds from quietly going stale.
What App Maintenance Costs Typically Include After Launch
Most budgets cover two of the nine categories below and quietly absorb the rest into a vague line called support. Naming them is the cheapest way to get a defensible annual number.
- Infrastructure. Compute, storage, databases, backups and data egress. Egress is the one that surprises people, because moving data out of a cloud region is billed separately from running it there.
- Monitoring and observability. Error tracking, performance monitoring, uptime checks and on-call rotation. Cheap for a small app, expensive for a platform with an availability commitment.
- Third-party services. Maps, geocoding, messaging, push delivery, payment processing, identity and analytics providers. These are metered, so the bill tracks usage, not your headcount.
- App store operations. Annual developer program fees, store listing updates, review responses and handling rejected releases.
- Corrective maintenance. Crash fixes, broken flows, device-specific bugs and data defects found by users rather than by your team.
- Adaptive maintenance. Keeping up with new iOS and Android releases, SDK deprecations, API version changes and new device form factors.
- Preventive maintenance. Security patches, dependency upgrades, refactoring to keep the code testable, and capacity work before traffic arrives.
- Perfective maintenance. Small feature work and UX improvements. This is the category that grows the most when a product team has spare capacity.
- Support and compliance. Help desk coverage, accessibility remediation, privacy and records-retention obligations, and periodic audits.
A useful way to split that list is by who owns the line. Labor is the developer hours. Everything else is a vendor invoice, and vendor invoices are the part that scales with users rather than with your roadmap.
What Affects App Maintenance Prices
The percentage benchmark is a starting point, not an answer. The same 20 percent can mean 12,000 USD a year for one team and 300,000 USD for another, and the variables behind that gap are worth naming before anyone signs a post-launch agreement.
- Active users. Support load, infrastructure and API usage all scale with people in the app, not with the number of screens.
- Uptime expectations. A 99.5 percent target is a different staffing model from best-effort service, and public-facing apps usually carry a published commitment.
- Number of platforms. Native iOS and Android means two release trains and two sets of device quirks. A cross-platform codebase cuts that roughly in half and adds a framework upgrade tax.
- Data sensitivity. Health, payments or citizen records bring audit work, encryption review and incident response obligations that an ordinary app never sees.
- Number of integrations. Every external system is something that can change its API without asking you. Each one needs an owner and a monitoring alert.
- Legacy dependencies. A three-year-old SDK with no updates is a recurring tax paid in security advisories and blocked device releases.
- Support commitments. Response times inside a service level agreement are priced differently from a best-effort email address.
- Geographic coverage. A utility app serving three states behaves nothing like one serving a metro area with strict local data residency rules.
- Defects versus improvements. Fixing what is broken is cheaper than adding what is new. Teams that fund improvement work end up with a larger bill by design.
How Much Does App Maintenance Cost for a Small App?
For a low-traffic internal tool or an MVP that a handful of people use, expect somewhere between 1,900 and 7,000 USD a month in total, or 23,000 to 84,000 USD a year. Much of that is one part-time engineer rather than a team.
A lean arrangement is usually a managed service that patches dependencies, runs monitoring and handles store submissions, billed as a flat monthly figure with a small day bank for actual changes. The alternative is a small agency retainer, which buys you a named engineer and a response time but costs several times more. The deciding question is whether anyone on your side can read a stack trace; if nobody can, the managed service is usually the cheaper answer.
How Much Does App Maintenance Cost for a Public or Civic App?
A public-facing civic or consumer app sits in the 10,600 to 39,000 USD monthly band, which works out to roughly 127,000 to 468,000 USD a year. Expect 20 to 30 percent of build cost, and plan for the upper end when the app handles accessibility obligations, citizen data or service integrations.
Three things push a public app up that an internal tool never pays. Accessibility remediation is continuous rather than a single project, because every new screen has to meet the standard. Citizen support runs on a schedule that public expectations set, and a slow answer to a parking fine generates more messages than the whole rest of the month. And privacy obligations around location and identity data arrive as recurring review work rather than a one-time sign-off.
How Much Does App Maintenance Cost for a Smart-City Platform?
A platform that connects sensors, transit systems, identity services and several municipal departments runs from 40,000 to 158,000 USD a month. At that scale the percentage benchmark moves to 25 to 40 percent of build cost, and the labor share often drops because the money goes into infrastructure and integration upkeep instead.
What drives the bill is the number of upstream systems, not the size of your own codebase. Every sensor gateway, schedule feed and departmental database needs its own health check, its own failure handling and someone to answer when it stops reporting at 2 a.m. Identity and access systems add another layer, because a single sign-on provider that changes a certificate can lock out your entire user base. Technical-debt reduction shows up here too, usually as a planned quarter each year rather than an emergency.
Why Maintenance Costs Increase Over Time
Year one is the cheapest year you will ever have, and that surprises people who budgeted for the ramp-down after launch. The reason is simple: a fresh app has few users, few integrations, little data and no accumulated mess. Each of those grows.
Here is what a mid-sized consumer or civic app actually looks like over three years, assuming a build cost of 250,000 USD.
| Period | What is happening | Maintenance cost |
|---|---|---|
| Months 1 to 3 (launch quarter) | Crash triage, store feedback, first integration breakages, monitoring setup | 45,000 USD |
| Months 4 to 12 | Routine fixes, first OS releases, growing support volume | 130,000 USD |
| Year 1 total | Build is done; spend has not settled yet | 175,000 USD |
| Year 2 | Larger user base, new integrations, dependency debt surfacing | 200,000 USD |
| Year 3 | Legacy dependencies, compliance work, technical-debt cleanup | 225,000 USD |
| Three-year maintenance total | Against a 250,000 USD build | 600,000 USD |
| Three-year cost of ownership | Build plus maintenance | 850,000 USD |
Roughly 70 percent of that three-year spend lands after launch. That is the number to take into a budget meeting, because it inverts the assumption most teams carry out of the build phase.
Four forces push the curve upward. Technical debt compounds: a small shortcut taken under deadline gets more expensive every time someone works near it. Dependencies age and stop receiving updates, which turns routine work into research. Data volume grows, so database queries and backups get slower and costlier. And every new integration adds a new thing that can break without you touching any code.
Regulation plays a role too, mostly on civic and health apps. A new privacy requirement arrives as a deadline rather than a request, and it lands on top of work that was already committed.
Ways to Save on Post-Launch App Maintenance
These are the methods that hold up because they cut real work rather than deferring it.
- Prioritize core workflows. Write down the three things users must be able to do, and freeze everything else until those are stable. Scope discipline is cheaper than headcount.
- Document the architecture. An accurate one-page map of services, data flows and integration owners saves the days lost to reverse-engineering after someone leaves.
- Automate monitoring, backups and releases. Manual checks work until the week you are on holiday, and that week usually has an incident in it.
- Manage dependencies on a schedule. A weekly check for available updates and a monthly install is far cheaper than an emergency upgrade of something with a published vulnerability.
- Use staged rollouts. Releasing to a slice of users first turns a potential outage into a small, cheap mistake.
- Define support limits in writing. Hours per month, response times, what is out of scope. Ambiguity here is where invoices grow quietly.
- Archive inactive features. Code paths nobody uses still get patched, tested and reviewed. Removing them removes cost.
- Reserve the budget before launch. Set the annual allocation while the build budget is still the conversation. Deciding afterward guarantees the shortfall.
Frequently Asked Questions
How expensive is it to maintain an app?
Most apps land between 15 and 25 percent of their initial build cost per year, rising to 25 or 40 percent for regulated or platform-heavy products. In practical terms that is roughly 23,000 to 84,000 USD a year for a small internal app, 127,000 to 468,000 USD for a public-facing app, and 480,000 USD and up for a connected platform.
Is it true that 80% of the lifetime cost of a piece of software goes to maintenance?
It is directionally right for apps and wrong as a rule. The share depends on how long you keep the app: the longer it runs, the more of its cost falls after launch. A three-year-old app commonly spends 70 to 80 percent of its lifecycle cost post-launch, while an app retired after a year can be closer to half. Use it to argue for an early decision, not a fixed percentage.
Does Google take 30% of in-app purchases?
For enrolled developers, Google Play applies a 30 percent service fee on the first portion of in-app purchase revenue and a reduced rate above that threshold. Apple runs a similar tiered structure, and both programs charge an annual or one-time developer fee on top. Digital goods are the strictest case, while physical goods and services follow different rules.
How much does it cost to host an Android app?
Hosting depends almost entirely on how much traffic and data you move, not on the platform itself. A small internal app running on managed backends often costs a few hundred USD a month. A public app with tens of thousands of active users typically runs 800 to 4,500 USD a month once databases, backups, monitoring and data egress are counted. Media-heavy apps sit at the high end because storage and egress dominate.
What are the hidden costs of maintaining an app after launch?
The ones that catch teams out are data egress, third-party API metering, push and SMS delivery, observability tooling, an annual developer program fee, accessibility remediation, and emergency fix premiums outside normal hours. On a civic or public app, records retention and privacy review add recurring hours. None of these appear in a build quote, and all of them recur.
Why do app maintenance costs increase over time?
Five things compound. Users arrive and bring support load with them, data volume grows so queries and backups cost more, integrations multiply and each one can break on someone else’s schedule, dependencies age until routine upgrades turn into research, and technical debt makes every nearby change slower. Regulation adds deadlines on top, so the yearly bill trends up even when the feature set does not.
Conclusion
Maintenance costs add up after launch because they arrive as a dozen small recurring lines instead of one lump sum, and every one of them grows a little as the app ages. Start with the percentage benchmark, then price it properly by listing every integration you own, estimating monthly active users and the support volume that follows, naming your security and accessibility obligations out loud, and putting a 12-month reserve in the budget before any post-launch agreement is signed.